Grafana - InfluxDB - Telegraf (GIT) monitoring setup via docker

UPDATE: 11/06/2021 - I have added a new article with the up-to-date version of this stack. The new stack uses the new InfluxDB 2.0+ so be sure to use that article if you want the latest version

This will be a short post on setting up a great platform for all your monitoring needs. Let me start by saying that using this setup is not limited to Synology, your NAS and its specs. You can use this setup with any outside device. the only requirement is that you can capture its metric. If you can, Grafana will surly be able to present it.
There is a huge number of situations that you might wanna capture your data and present it in real time (or over a period) in a nice, custom visual presentation. Grafana is one of the best tools to do that. In this tutorial I will show how you can easily start with Grafana to get the basic info on your Synology NAS (or multiple number of them), some docker info and even some speed test results.
To begin with this we will be using 3 docker images/containers:
Grafana - https://hub.docker.com/r/grafana/grafana - front end that will serve as a UI for all your dashboard needs
InfluxDB - https://hub.docker.com/_/influxdb - back end that will serve as a database for all the metrics that your setup will collect
Telegraf - https://hub.docker.com/_/telegraf - agent that will collect actual metic and push them into InfluxDB
So first thing first. The order this setup needs to be configured is creating the DB, running the agent and then present them in the UI, so, InfluxDB, Telegraf and then in the end Grafana.
InfluxDB configuration
UPDATE: This article was based on Influx 1.x version. If you are running Influx 1.x version and want to update to version 2.0 or higher, keep in mind that there are steps that need to be followed or you will get in trouble if the migration/upgrade is not done as it should be. Follow the instructions on the InfluxDB docker repo site.
So before we actually setup the container, we need an influxdb configuration file. After you have downloaded the image, log into your NAS via SSH as root and run the following command to generate a default influxdb configuration file:
docker run --rm influxdb influxd config > /docker/containers/influxdb/conf/influxdb.conf
NOTE: If you get warning saying "No such file or directory" it means that your destination location is missing permissions needed to generate such file. Add "Everyone" read/write permissions to the folder to get around this. You can later on, change and remove this permission once the file has been created.
What this command will do is use influxdb image to run influxd command and create influxdb.conf file to a destination of your choice. Afterwards you can edit it or not depending on your needs (maybe you want influx on a custom port, ip address etc...).
Now that we have the config file we can start with the container creation:
docker create \
--name influxdb \
-e PUID=1000 -e PGID=1000 \
-p 8083:8083 -p 8086:8086 \
-v /docker/containers/influxdb/conf/influxdb.conf:/etc/influxdb/influxdb.conf:ro \
-v /docker/containers/influxdb/db:/var/lib/influxdb \
influxdb -config /etc/influxdb/influxdb.conf
Like any other docker image, influx also has several volumes and ports that need to be setup. Mapping your config file and an outside folder that will actually keep the influxdb data are the most important ones.
After you have InfluxDB up and running it's time to create the DB inside the instance. To do this, connect to the container via a bash command and run the following:
01. INFLUX (connect to influxdb instance on port 8086)
02. CREATE DATABASE <database_name>
03. SHOW DATABASES
That's it! One down 2 to go.
Telegraf configuration
Same as with Influx, Telegraf needs an outside configuration file that it will use to know what metric to collect, at what speed and also where to place it.
You can grab a default config file from here: https://github.com/influxdata/telegraf/blob/master/etc/telegraf.conf
With the file downloaded be sure to edit and uncomment lines 105 and 112 to add your InfluxDB connection parameter as well as the database name. Current example is this:
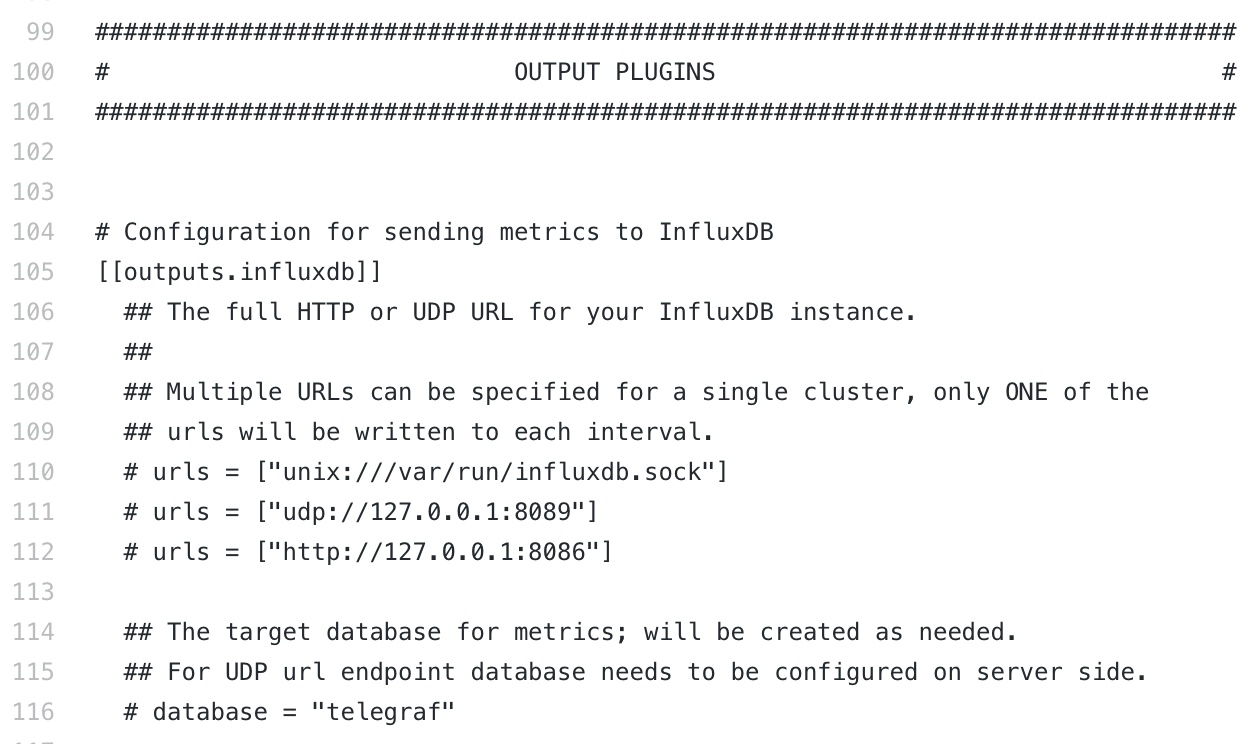
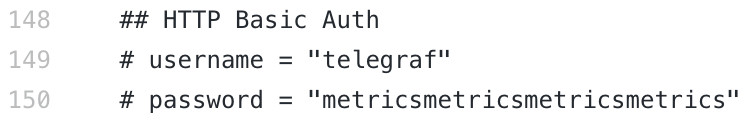
Remove comments on lines 149-150 and you can configure telegraf credentials.
With all that in place, its time to create the container:
docker run -d \
--name=telegraf \
--restart always \
-v /volume1/docker/telegraf/config/telegraf.conf:/etc/telegraf/telegraf.conf:ro \
-v /var/run/docker.sock:/var/run/docker.sock:ro\
-e "HOST_PROC=/host/proc" \
-e "HOST_SYS=/host/sys"\
-e "HOST_ETC=/host/etc"\
-v /sys:/host/sys:ro \
-v /proc:/host/proc:ro \
-v /etc:/host/etc:ro \
--net=host \
--pid=host \
-p 8092:8092 -p 8094:8094 -p 8125:8125 \
telegraf
This docker run command line contains also variables to connect to your docker and pull data from it as well.
Now that we have our agent and DB up and running it's time to setup Grafana to start presenting some data.
Grafana configuration
docker create -d \
--name=grafana \
--restart always \
-v /volume1/docker/grafana:/var/lib/grafana \
-p 3000:3000 \
-e GID=472
-e PID=472
grafana/grafana
Considering that Grafana is just a front end UI there is almost no configuration on the docker front apart from the external destination for its configuration part and web ui port.
Making it all work
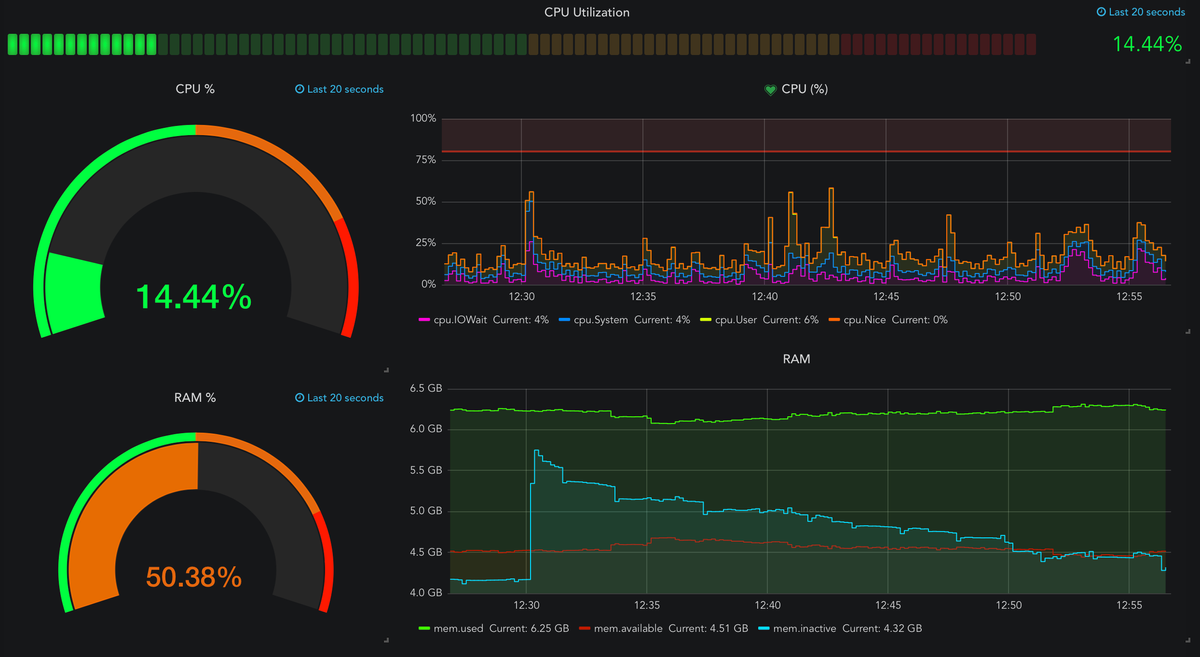
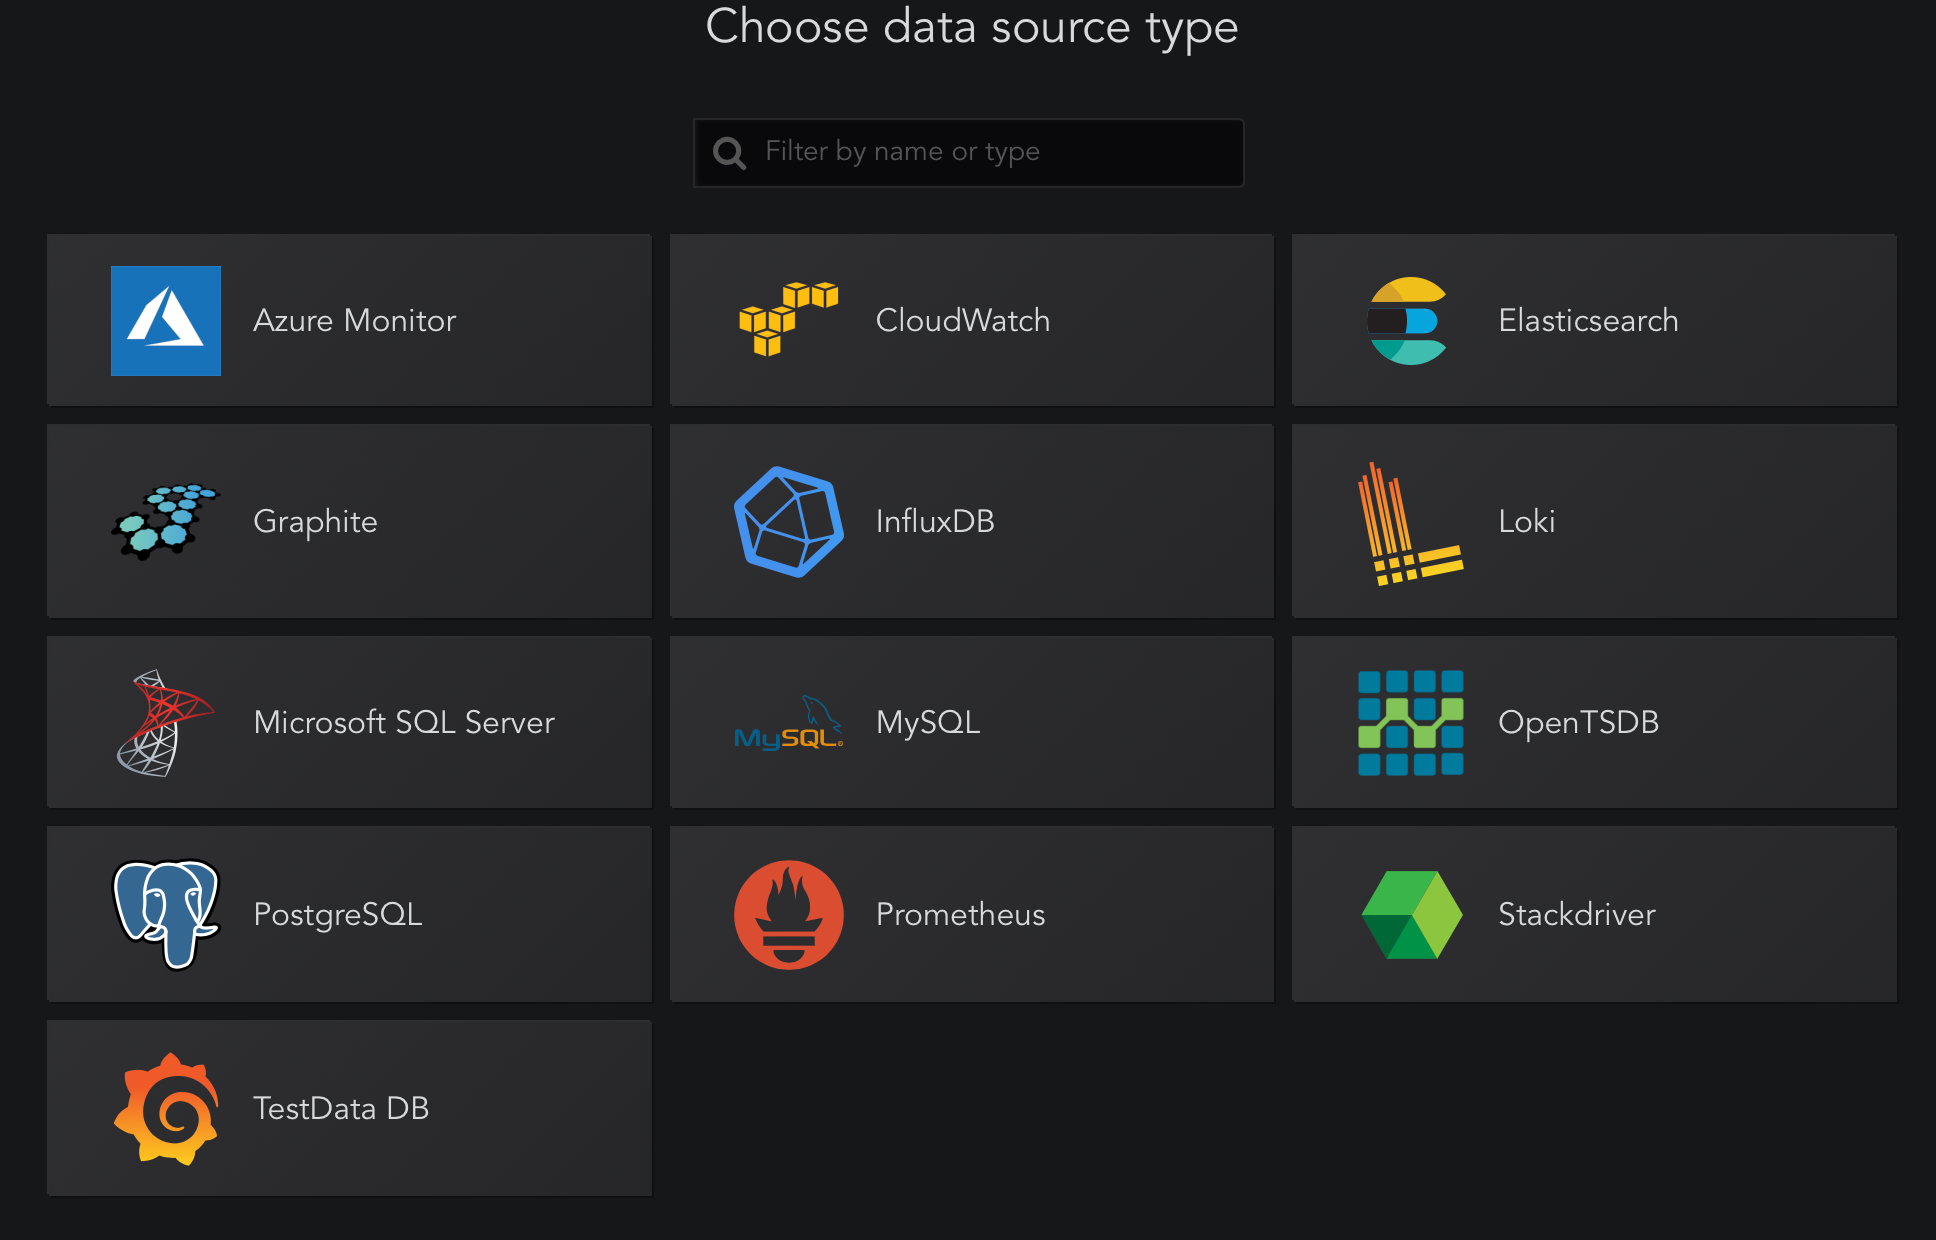
Now that we have all 3 containers up and running, we can begin to see the benefits of it. Log into your grafana web UI and configure Data Source(s):
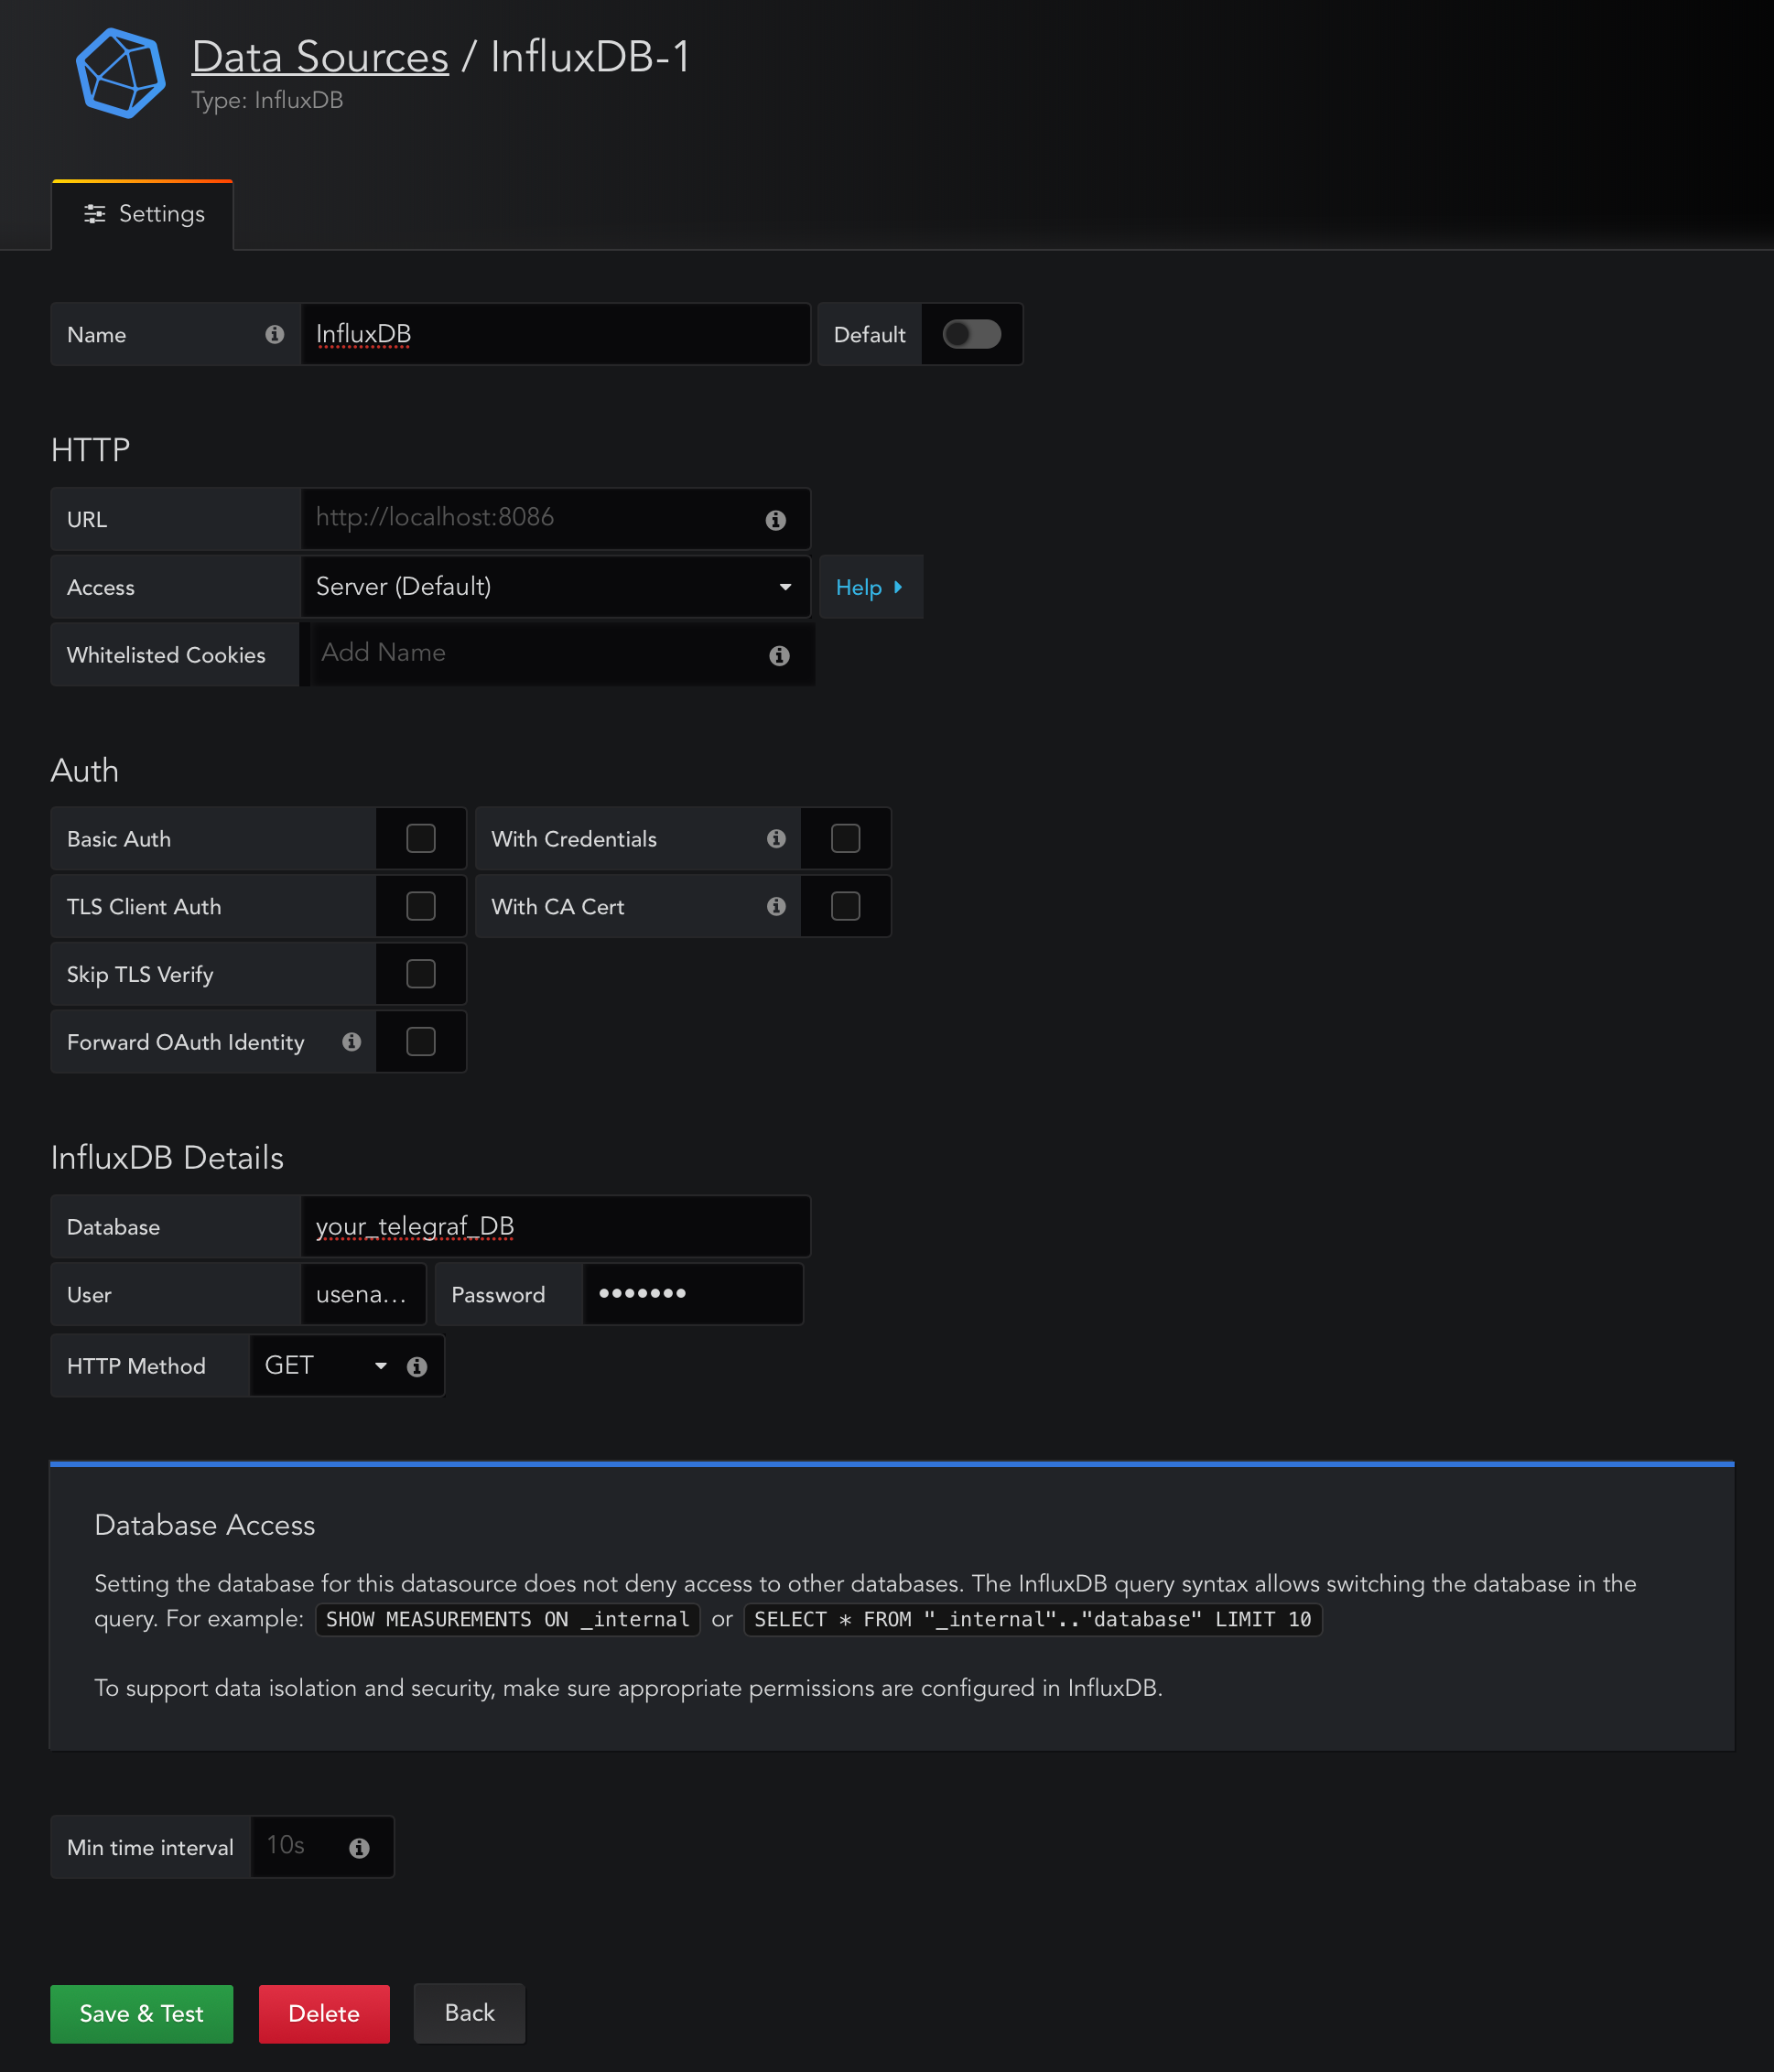
After you enter your InfluxDB IP address and port (that will be your NAS local IP and port number that you have configured with InfluxDB docker, then just enter Telegraf database, username and password. If all is setup correctly, click the Save & Test to connect grafana to your influxdb instance.
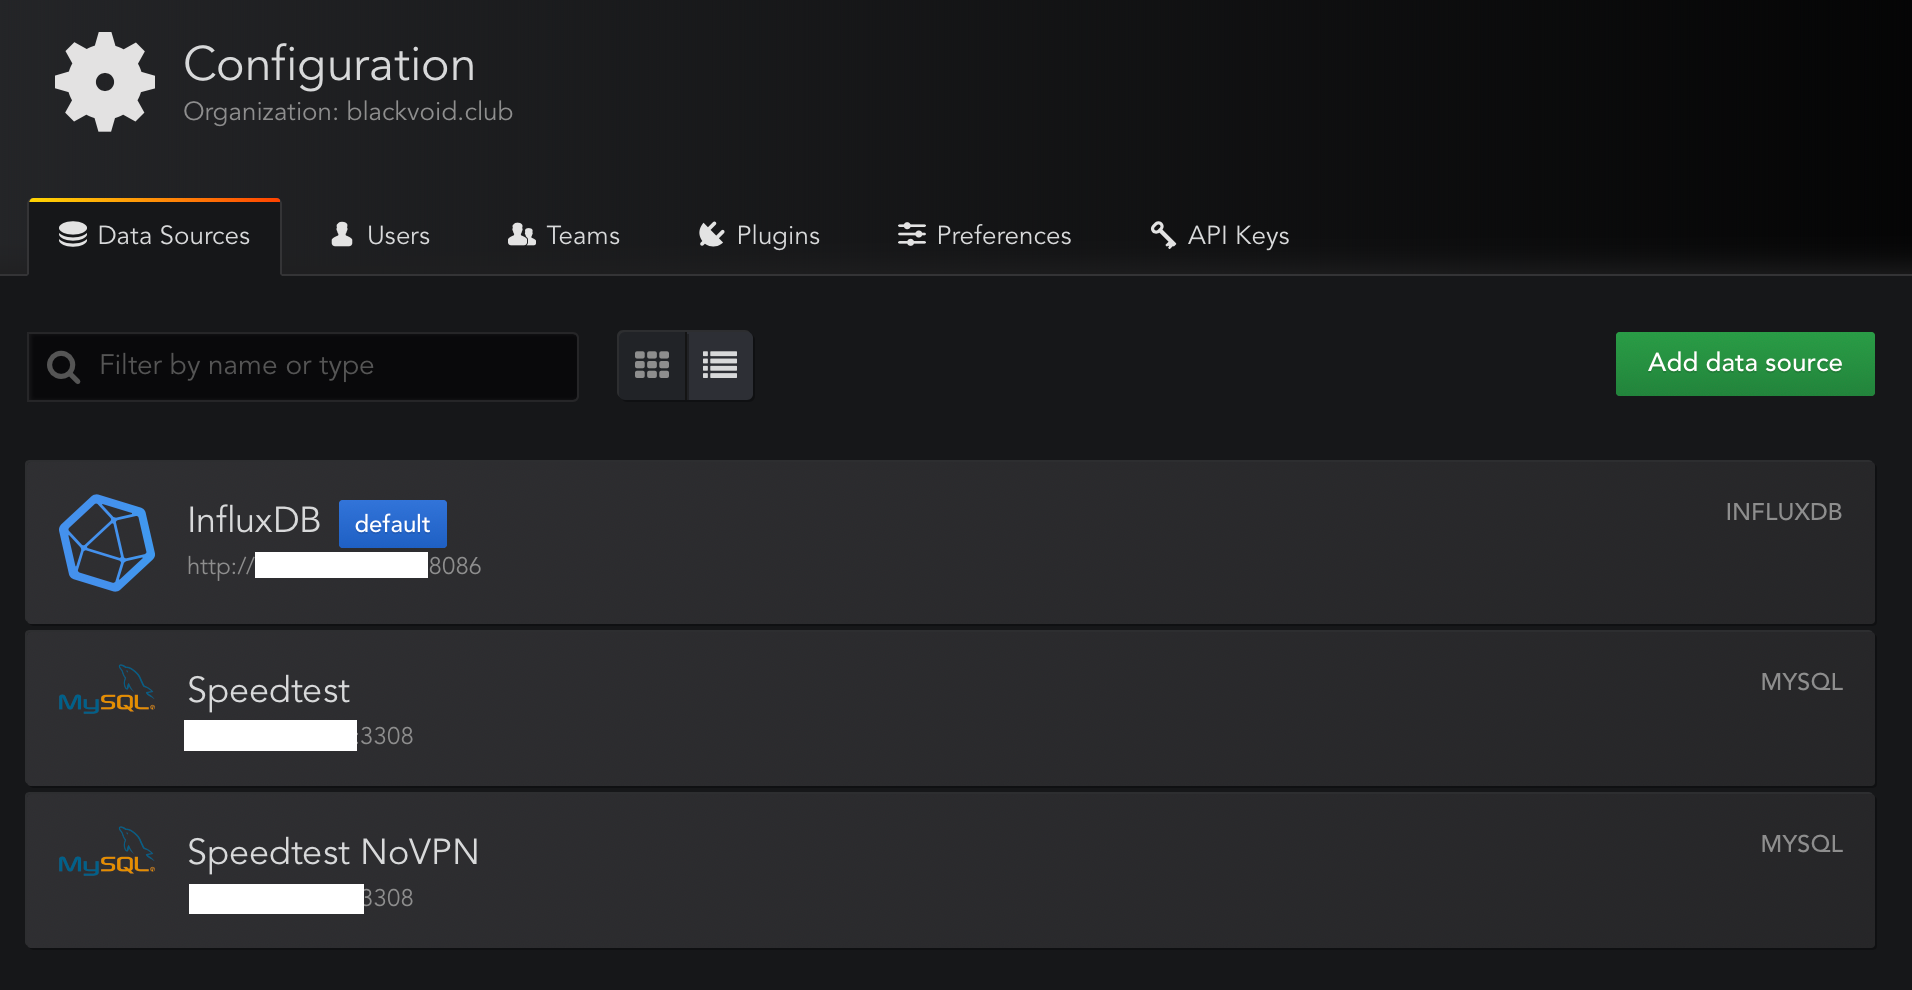
Well, now that you have added your InfluxDB as a source, you are ready to make some dashboards gathered by the metric info.
Make sure to edit the telegraf config file for any metric that you might need. Just remove the comment line, save the file and restart telegraf docker container