k6 - load and performance testing platform


Ever wanted to test out how fast your site was? Then you probably heard of JMeter? Well, today I would like to turn your attention to an open-source platform that’s not running in a UI under Java (?!?!) but rather from the command line. The best part is, your can Docker it.
Loadimpact is now k6
If you ever needed or wanted to run any type of smoke, soak, or stress tests, you probably heard of Loadimpact.com. Well, they have decided to rebrand as k6 Cloud. Still, as much as you can use their services from their cloud, you can use the complete solutions and pull it from GitHub if you want to run it locally.
If you are more like me, and running in Docker would be your choice, then just pull this image from Docker Hub.
So what is this all about? The idea behind this article is just to show you how simple it is to simulate visits on your site (or any web service) and the time needed for visitors to be presented with your content. Considering that you might want to see what would happen if you get an increased number of users in a specific time frame (let's say 10 or 100 users in 30 sec), k6 can help you simulate those requests and stress test your infrastructure and Internet speed to give you the overall idea where the problem might be.
Now in this article, I simply want to get you started. If you chose to dig deep, you can consult a detailed documentation on k6 website and start writing your own scripts.
Running k6 in Docker
Unlike most other Docker images that require volumes, ports, configurations, variables, etc, with k6 you simply need to download the image to your Docker platform, configure the script to your liking and run a single docker run command. That’s it. Let’s see this in action.
Step 01 - Log into your NAS via SSH as root and run docker pull loadimpact/k6 command. In case you just didn’t understand a word I wrote, you could use Synology Docker UI to download the image by going into the Image section of Docker, and after searching the image name, click the Download button.
Step 02 - On your NAS find a folder of your choice and inside it create a JS file with an optional name, let’s say script.js. The content of the file can be this:
import http from 'k6/http';
import { sleep } from 'k6';

export default function() {
  http.get('http://yourWebSite');
  sleep(1);
}
Keep in mind to change the URL parameter. Save the file and let’s move to the next step.
Step 03 - Now you will have to log into your NAS via SSH to run the docker run command and start testing. In case you don’t know how to log into your NAS via SSH here is a quick 101 course.
Go to Control Panel > Terminal and activate SSH option (default, port 22)
Now open up your Terminal app (Linux/macOS) or PUTTY (Windows) and enter the following:
Linux/Mac: ssh yourDSMaccount@yourNASIPaddress
Windows (via PUTTY): In the Host Name field enter your NAS IP address and click Open on the bottom
In any case, you will need to enter your username and password for your user that you are logging in. After you have connected next we need to elevate your session to root access.
Step 04 - Run the following command to elevate: sudo -i and hit return. Now enter your regular DSM password. After that, your command prompt should register root access.
Step 05 - Run the following command and change the path to your script that you created in step 2 to match.
docker run -i loadimpact/k6 run - </volume1/yourfolderlocation/script.js
Step 06 - Watch the results.
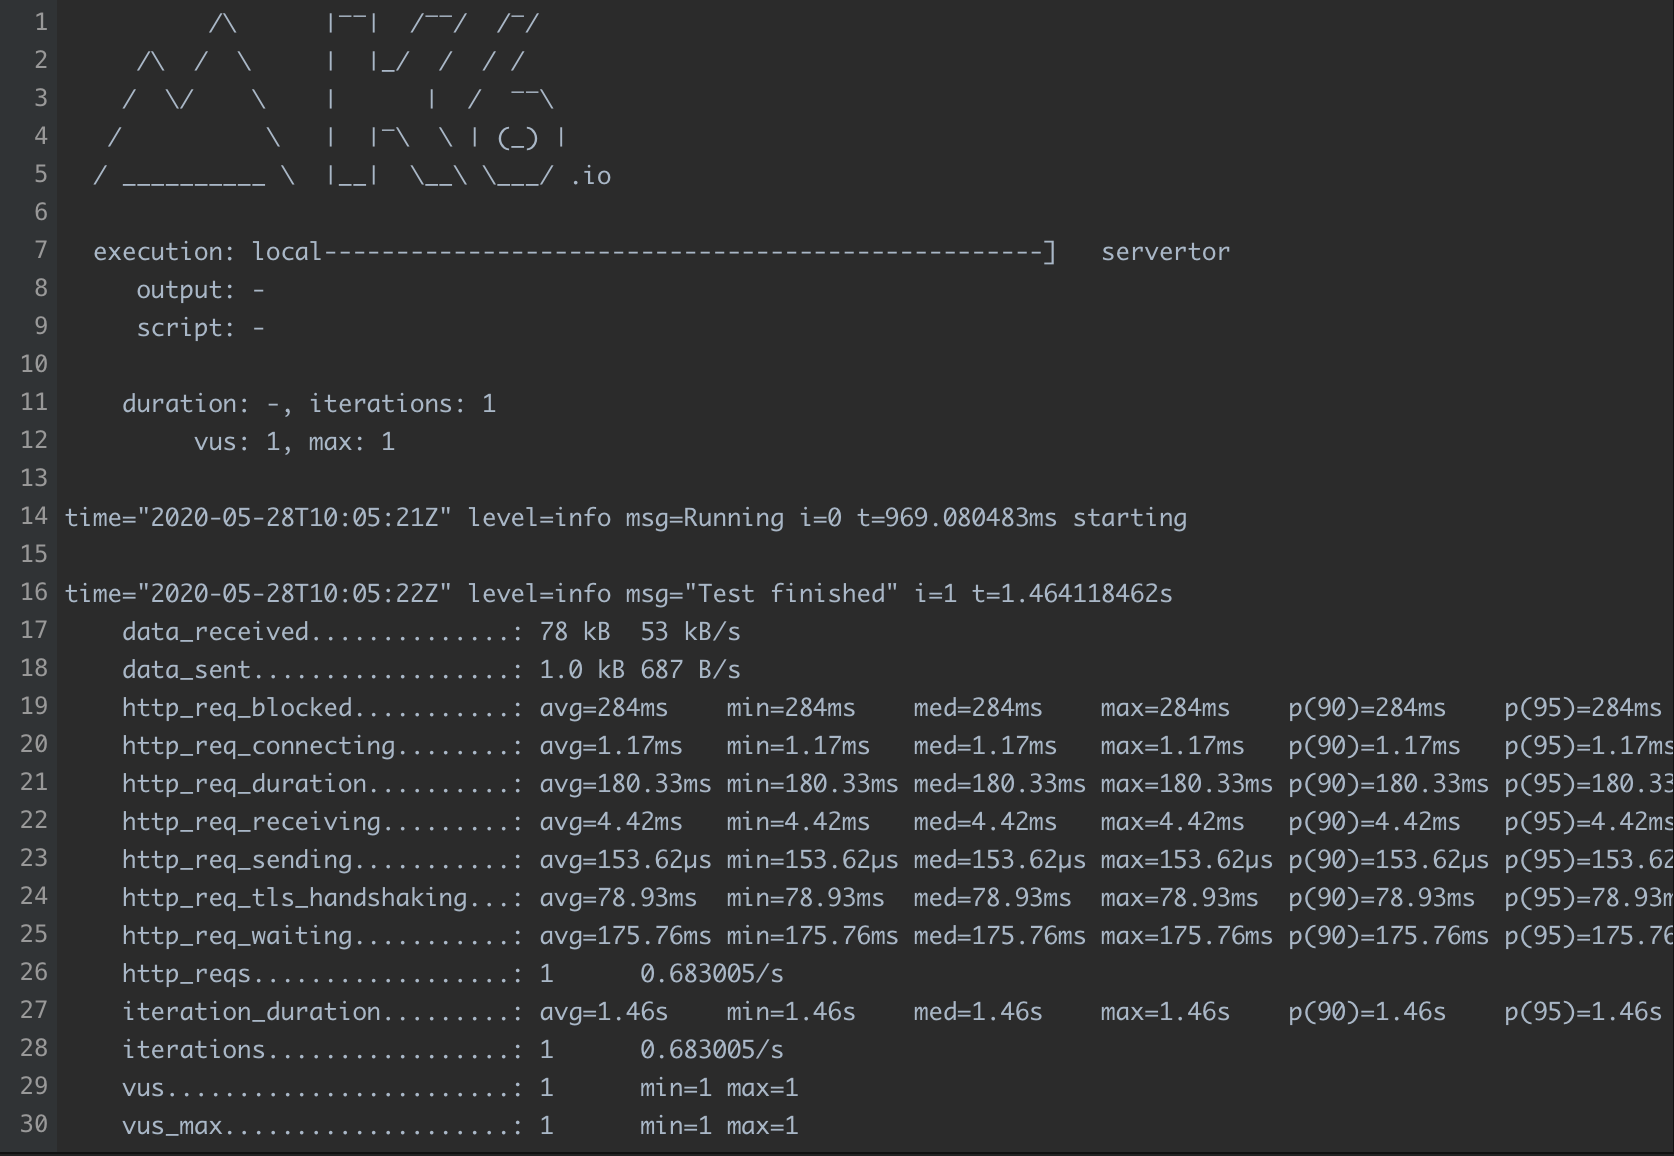
That’s it, you are done. As you can see from the results lot of details for such a small and quick script. If you want to test out multiple users over a longer period of time then you can run this command line.
docker run -i loadimpact/k6 run --vus 10 --duration 30s - </volume1/yourfolderlocation/script.js
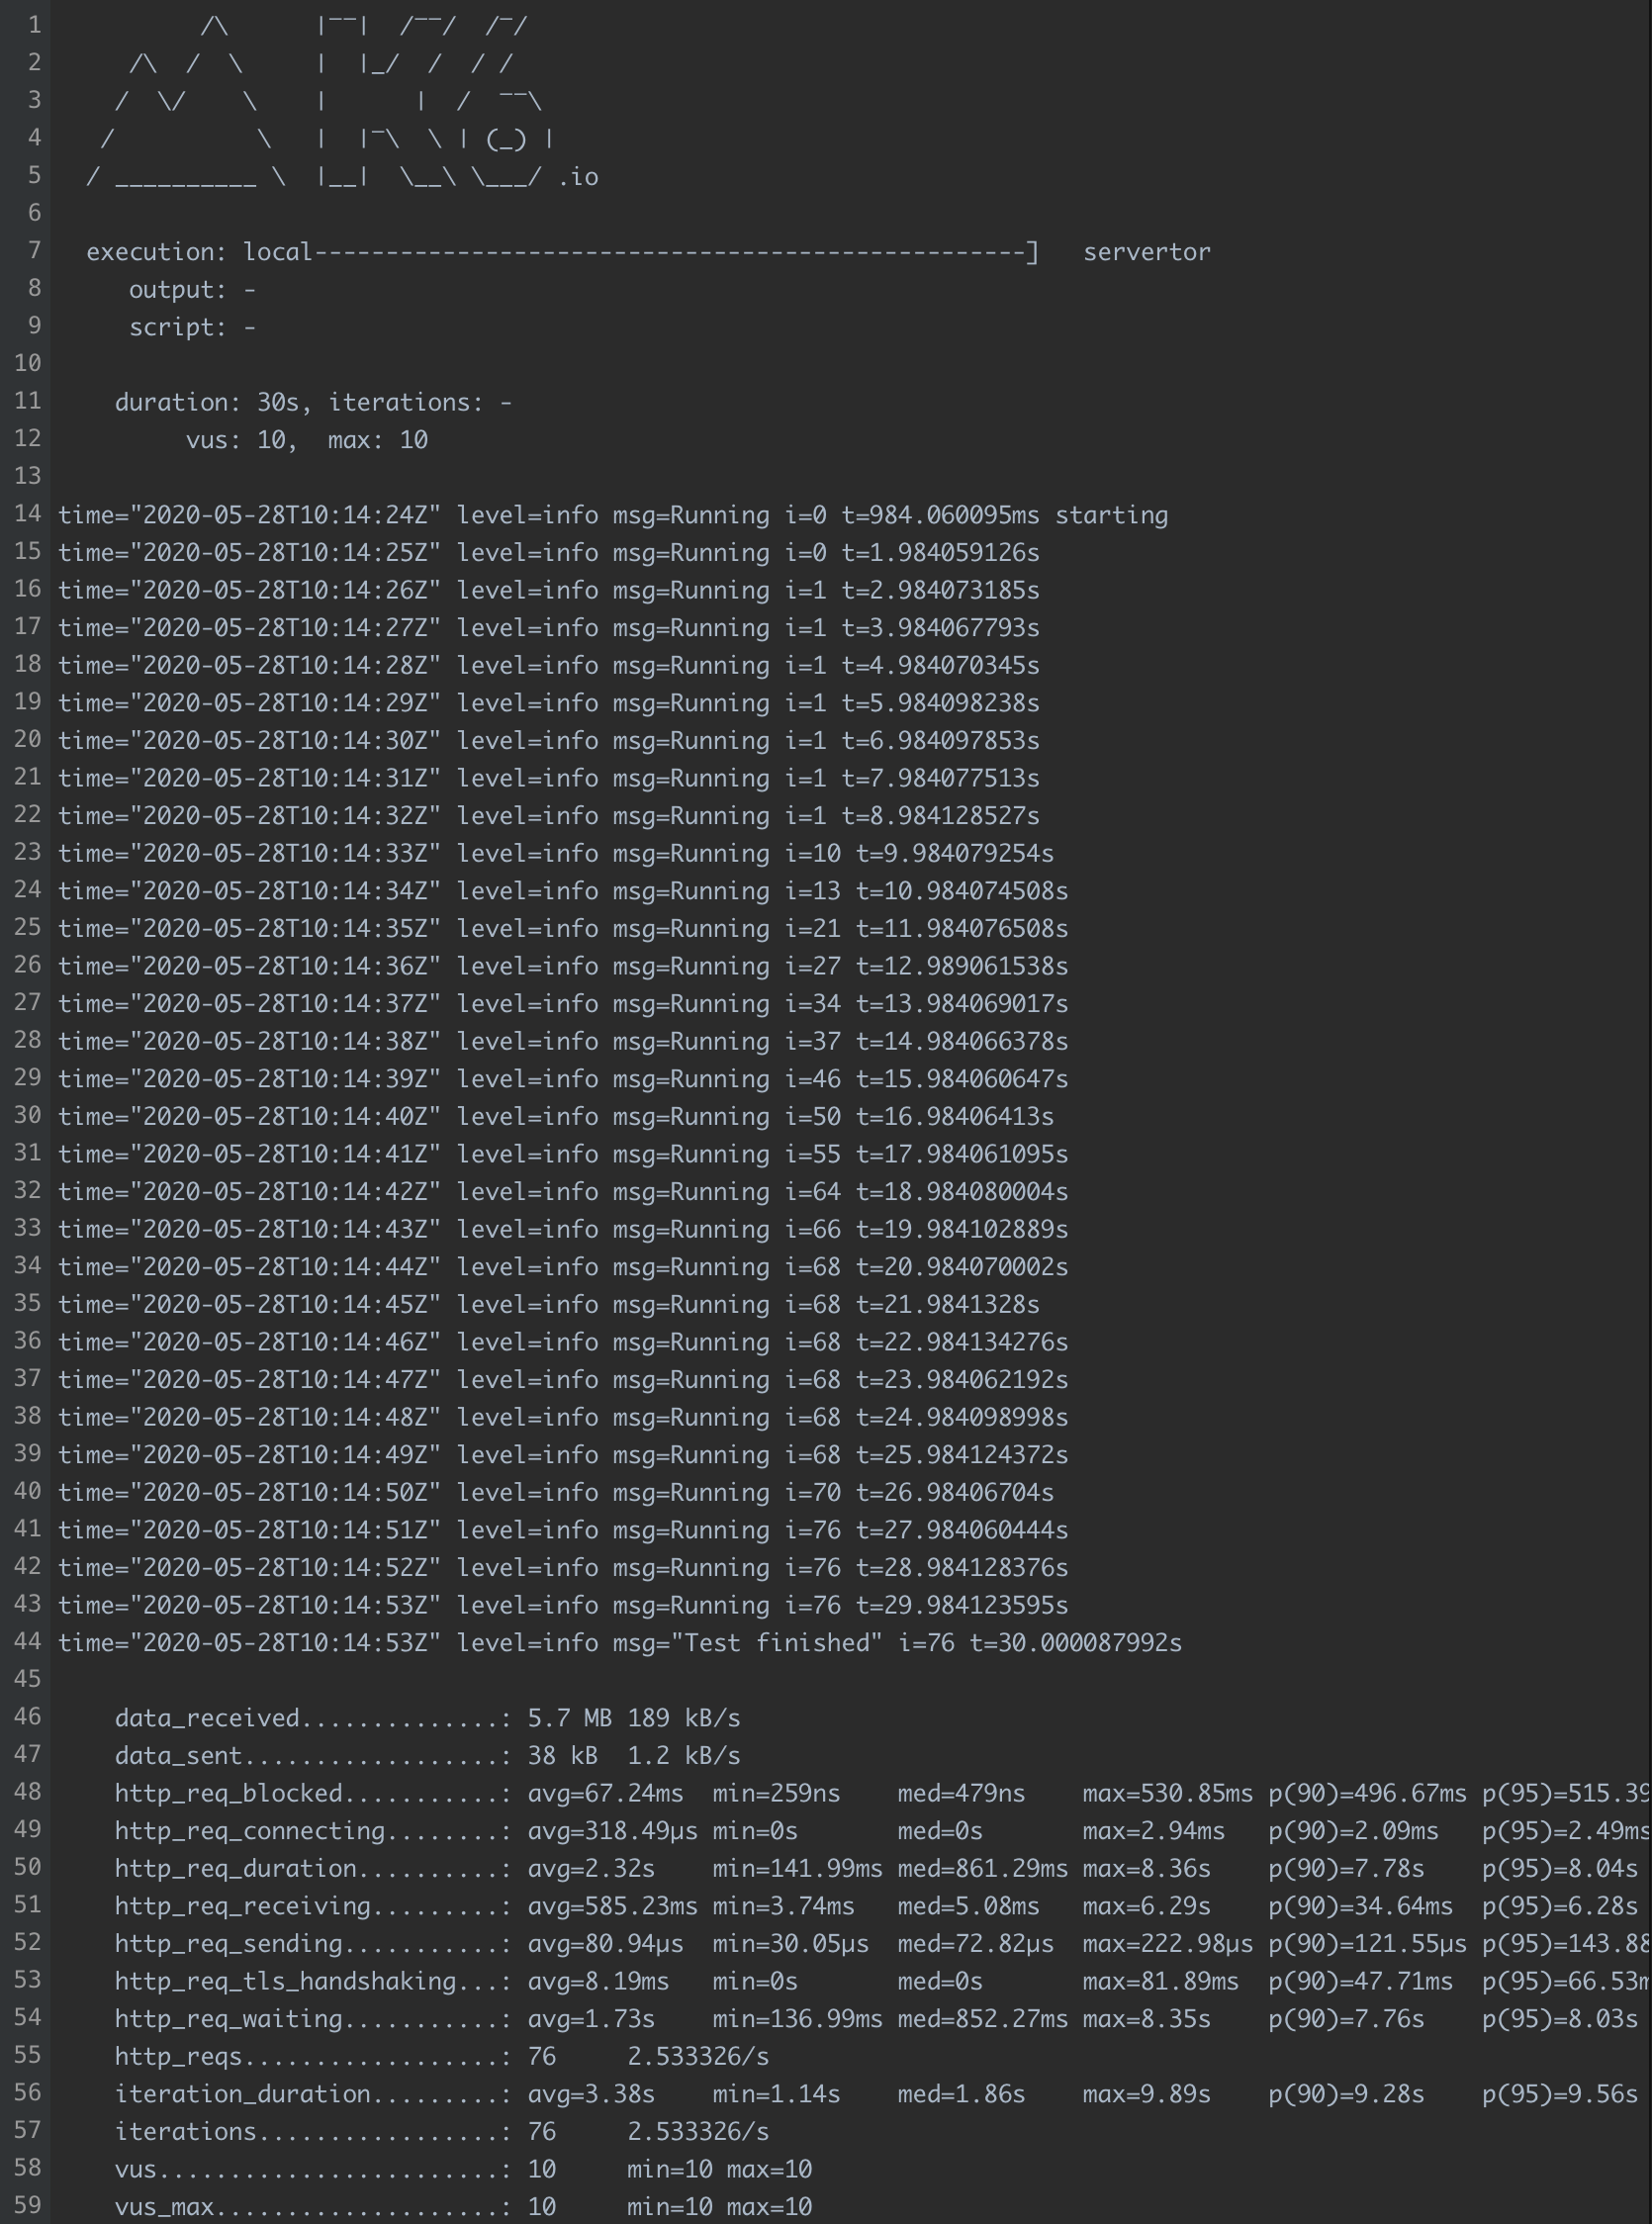
In this test VUS (virtual users) were increased to 10 and the duration is 30 seconds. The results look a bit different and give you the overall numbers what might happen if 10 users over 30 secs access your site.
Using custom scripts you can make an intensive and custom test, but for now, that will be it. Keep in mind that you can also output these metrics and results to InfluxDB automatically (and I might test that out that as some point and write back), so you have a lot of options.
I hope this will be interesting, especially to people who self-host and want to get more insight into how their environment behaves towards the outside world. As always, any comments are welcome on this topic in the comment section below.