Loki - log aggregation platform from the creators of Grafana

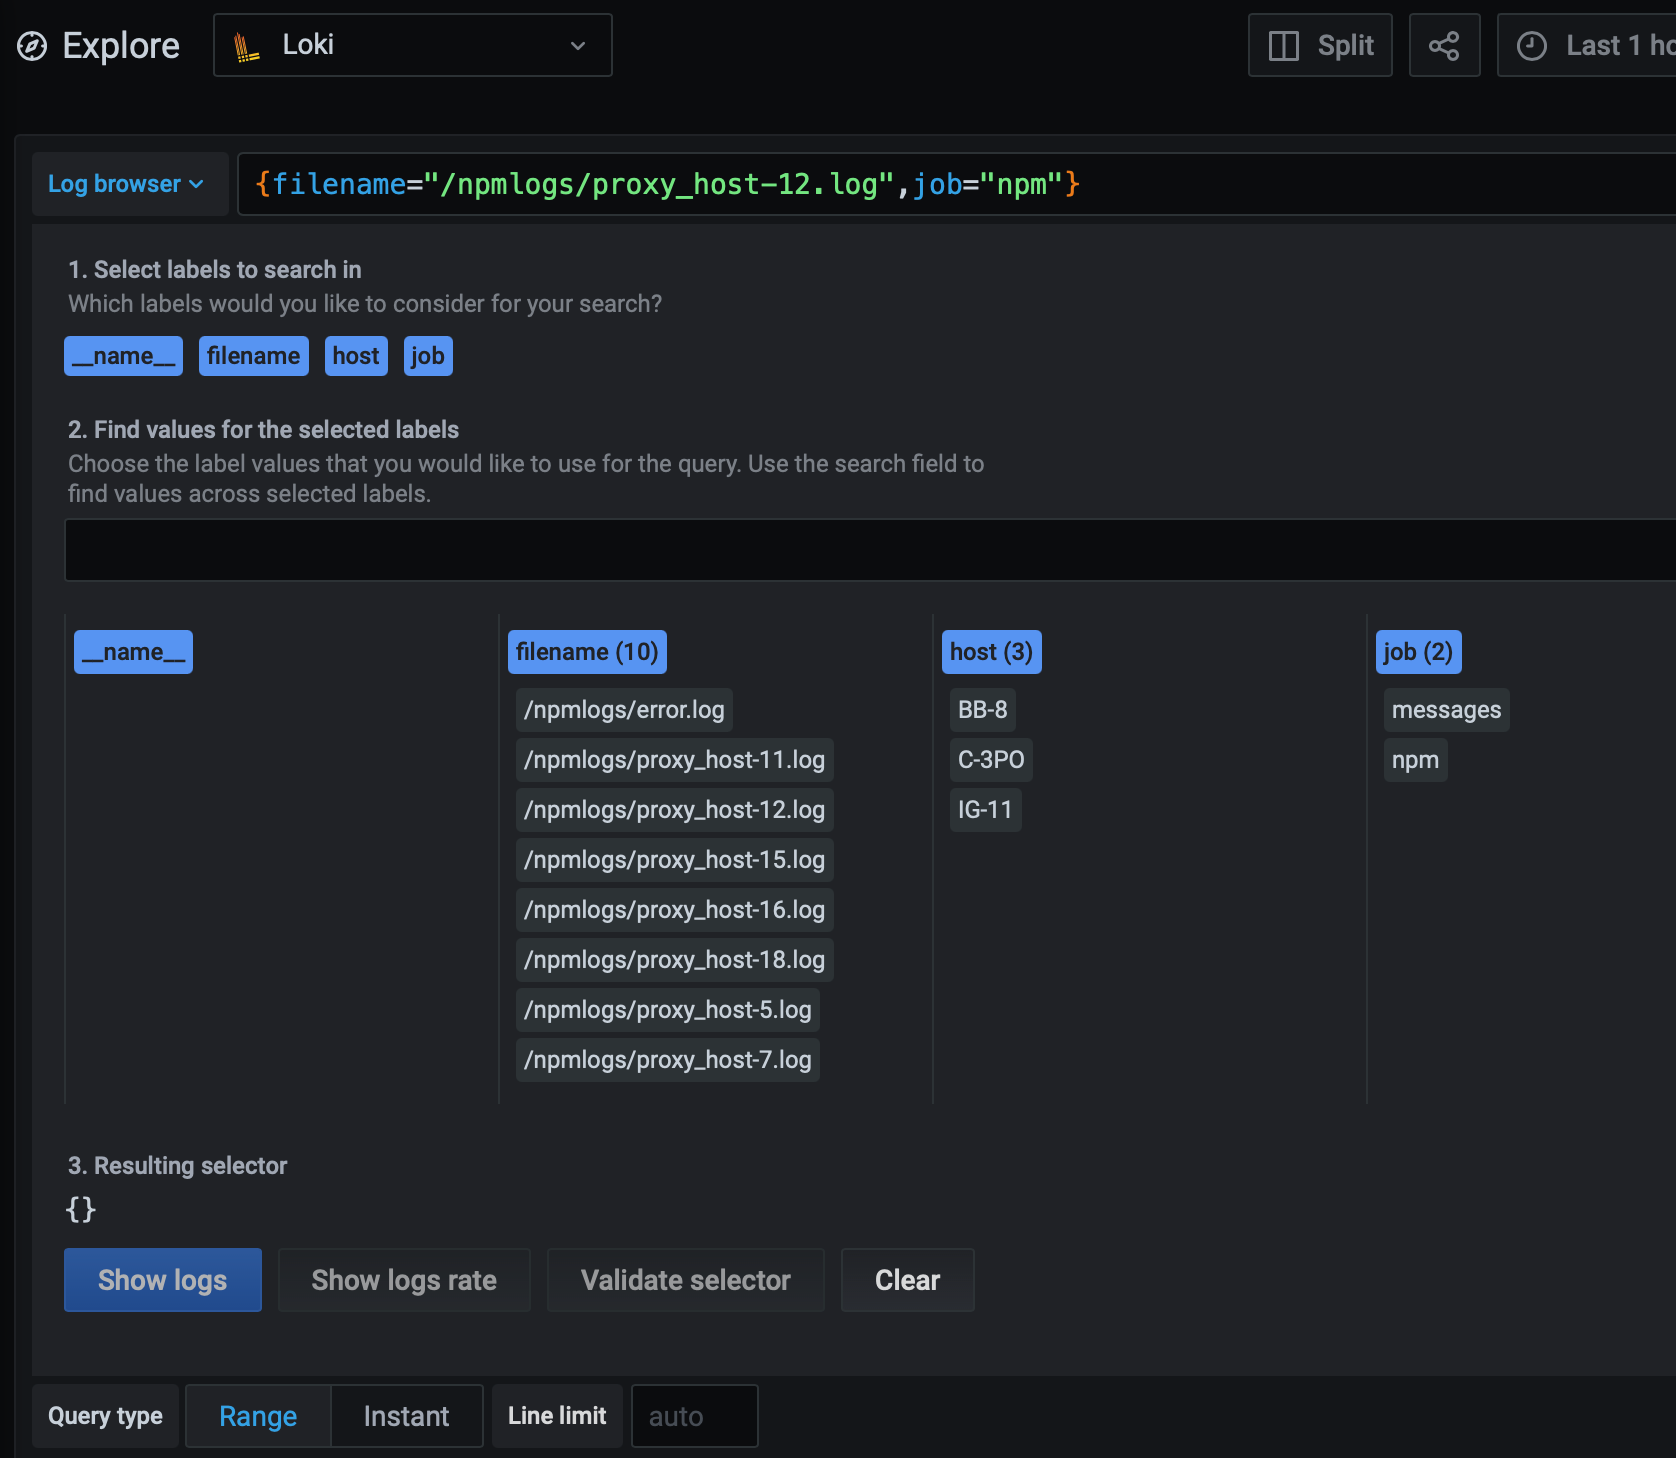
UPDATE: 12/05/2021 - Grafana 7.5.x supports new Loki log browser that will assist you with selecting labels and creating queries.
UPDATE: 29/09/2020 - After spending some time with Loki, I can say that it works really well and without any problems. For a quick overview of all you log needs, this is an excellent tool that offers a deep integration and analysis as well.
This article will be about running Loki, the new Grafana Labs platform for log aggregation. What Loki offers is to present the logs that you can then query, parse, and compare inside Grafana! How cool is that? Metric and logs in one place, as it should be. As with all platforms that I use, this one will also run inside Docker. (feel free to skip the intro if you are not interested until you hit the title Grafana + Loki + Promtail stack (GLP))
Searching for the right log aggregation platform
It has been a while since I have had a log parser. While back I have used Splunk Light that was running in Docker. Besides Splunk, there are many others out there. Some are free, some are not, some are heavy on the resources (and work with Java!!) others are not.
Considering that I had other things on my mind for the past few years, I have not bothered with a proper log parsing solution. Well at the moment I run 5 separate Synology NAS units on premisses, and various services on them, so checking logs has become a frequent thing.
Almost 99% of troubleshooting on Synology evolves around checking the /var/log/messages file where the majority of system logs and messages end up. So instead of connecting to each of them and tailing that file, it would be great that if I could get a better visual overview of those messages and also without the need to log into the NAS in the first place.
Well, considering that I use Grafana to display all my NAS system stats (several articles on Grafana and its features here), I always thought that it would be great that I could view logs inside Grafana as well. The time has come to make this possible. Enter Loki.
Loki - log aggregation platform that we have been waiting for
The development has started by the end of 2018 but today Loki has already so matured that it is a great tool to have and just what I have been looking for. Light and fast and able to capture logs from almost anywhere.
Loki is the log aggregator that crunches the data but that data has to come from somewhere right? Well to make this work we will need another Docker container, Promtail.
Consider Promtail as an agent for your logs that are then shipped to Loki for processing and that information is being displayed in Grafana. So log data travel like this:
App Logs (nginx, DSM, SQL...) > Promtail > Loki > Gafana
Now that we are clear on how data flow will work, let's see how to configure it all.
Grafana + Loki + Promtail stack (GLP)
I will separate this tutorial into three main sections, each talking about how one can configure Grafana, Loki, and Promtail separately (if you already have, or don't have some of these elements in use).
I will start from the end and work our way up to the presentation layer, so let's begin with the agent, Promtail.
Promtail - Docker setup
Before we continue I would like to note that this specific tutorial can be used for any number of log tailing situations, but I will focus on the Synology NAS logs by a method of reading specific log locations and files that are of my interest.
STEP01 - download Docker image and configure the container
Log into your NAS using SSH and elevate to root permissions using this command,
sudo -i
hit return and then enter your initial user password and you should land inside your NAS as root. The reason is that almost all operations on Synology NAS that involve Docker require super privileges, so best to do this as root.
Now pull the grafana/promtail repo using:
docker pull grafana/promtail
Once the image has downloaded run the following command as a single line! I will present it here broken down for easy reading but it should be run as a single line (no line brakes and backslash).
NOTE: Before you run the container, be sure to make a config.yml file using the sample below. Promtail will not work without it!
docker run \
--name=promtail \
-p 9080:9080 \
-v /volume1/docker/promtail/config.yml:/etc/promtail/config.yml \
-v /var/log:/var/log \
grafana/promtail
As I said above have this following file ready and configured to your needs! I will explain in detail what needs to be done in the next section. The point is that you will need to use a plain text editor (no fancy formatting needed) to create it.
STEP02 - Config.yml sample
server:
  http_listen_port: 9080
  grpc_listen_port: 0

positions:
  filename: /tmp/positions.yaml

clients:
  - url: http://IP_ADDRESS_OF_LOKI:3100/loki/api/v1/push

scrape_configs:
- job_name: system
  static_configs:
  - targets:
      - localhost
    labels:
      job: messages
      host: Enter the name of you NAS or any description that you want
      __path__: /var/log/{messages}
  - targets:
      - localhost
    labels:
      job: nginx
      host: Enter the name of you NAS or any description that you want
      __path__: /var/log/nginx/*.log
Let's spend some time explaining what's going on here. First off, you can use this file as a template or extend it to your needs using the official Promtail documentation.
server and positions parameters are default and unchanged. They can be configured and changed but I have decided to leave them as they are. The Port number of 9080 will be used later on to access Promtail using a web browser and see if the logs are getting tailed at all.
The position parameter is just a temp file that Promtail will use as a reference stop what logs and how far they have been processed.
So, the first thing that we need to configure here is the clients parameter. As I said before, Promtail will be getting some data and we need to tell it where the log aggregator, Loki in this case, will be listening.
Be sure to change the URL parameter by adding your NAS IP address where the Loki container will be configured (could be the same NAS or a public address for that matter) so that Promtail can reach it and push the logs.
The next bit is the most important one. Configuring your Promtail targets. This means that here we will configure what exact destination will Promtail tail on the device that Promtail is running on.
You will notice from the example above, that I have two target sections. This is because I wanted to specify exactly what I want this "agent" to follow and push to Loki.
So targets are configured to localhost meaning that I want this agent to monitor the device that it is running Promtail (so I have one Promtail on each of my NAS units).
Next, we have labels. These are optional and you can have many of them but I have decided on three: job, host, path(later we will see it is called filename in Grafana/Loki UI).
Their values can be whatever you see fit. So I have a job label value of name_of_file_or service, like nginx or messages. Why? So later I can have more clean visual representation inside Grafana what I am looking at. Another label I have used is host. It is a descriptive name of my NAS that Promtail is running on, so enter whatever you want it to be used as a display name inside Grafana. Like "Yoda" for example.
Finally, path (and yes there are double underline before and after). This parameter will dictate what location and/or file you want Promtail to monitor and tail. In my case, I have one path looking to my messages file and another looking to any .log file inside .../nginx/folder. For that, I use "*.log".
Hopefully, you are still with me so far, and yes this will be a long article but in the end, beneficial for you. I have spent some time here with Promtail because believe me this is the most important piece of all three. Without you get 0 logs and info.
STEP03 - Start Promtail
Before you start Promtail, be sure to copy the yml file that you have created and configured to the location that you have prepared for the docker run command (-v). In this example that will be /volume1/docker/promtail/config.yml.
Now start the container. Once the container is up and running you can check if any logs have started coming in by going to the URL: http://YOUR_NAS_IP:9080/targets.
The output will be similar to this:
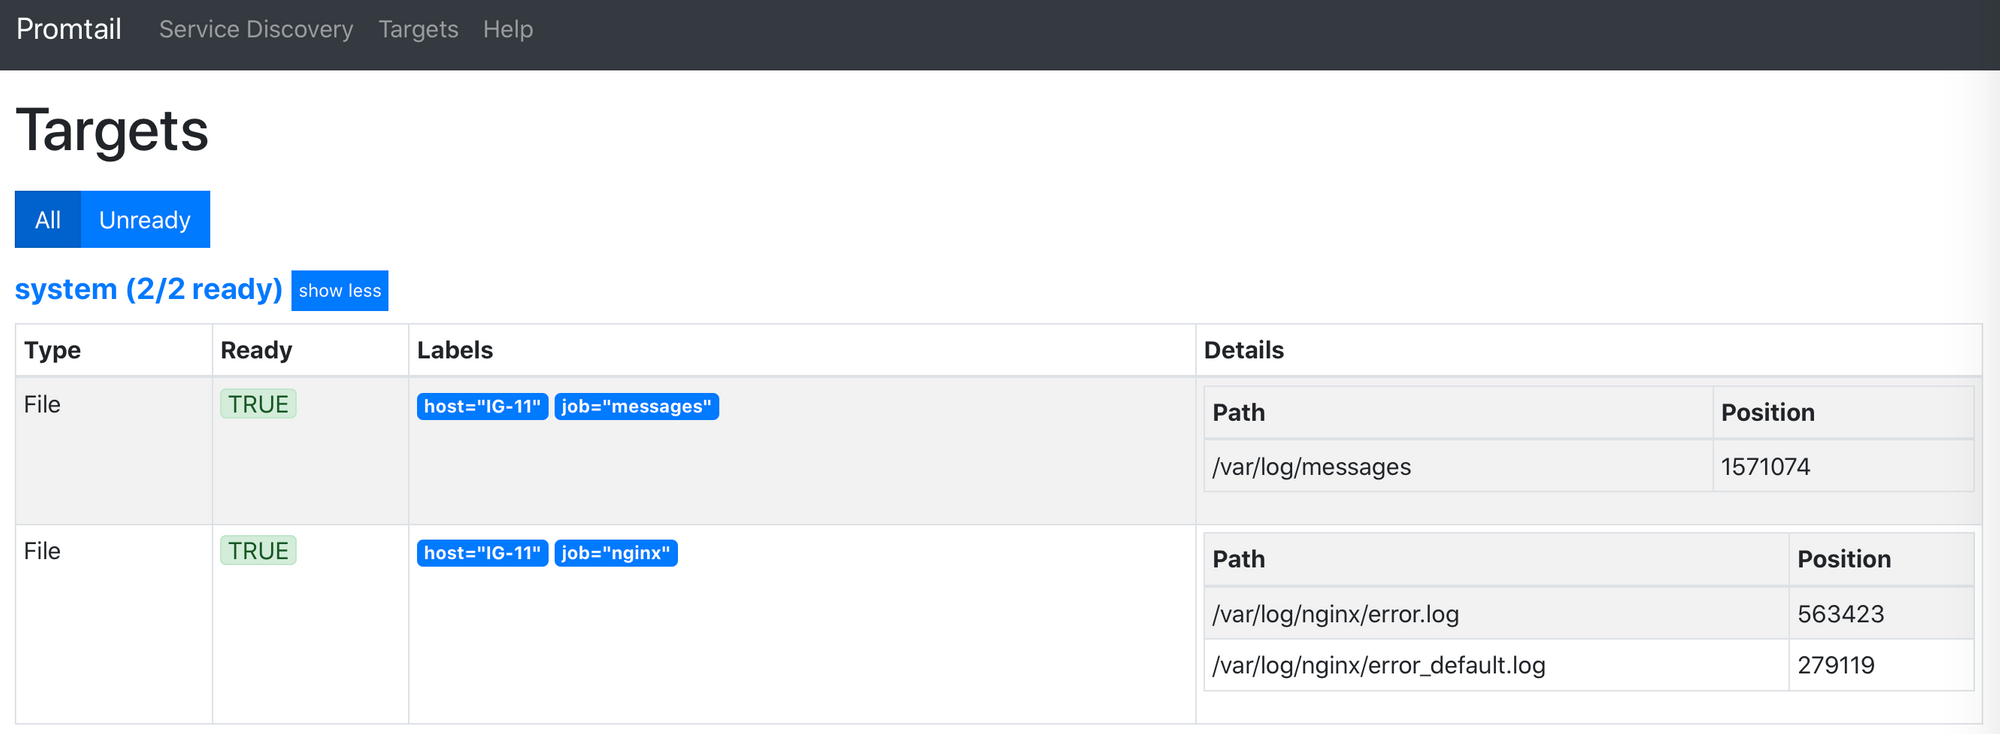
If you get this, you are well on your way to having your logs inside Grafana. Next up, Loki.
Loki - Docker setup
STEP01 - download Docker image and configure the container
Just like with Promtail, pull Loki repo from Docker hub:
docker pull grafana/loki
After it has downloaded, use the Docker run command again to create and start Loki. Once more, be sure to run it as a single line!
Also, just like with Promtail, we will need to configure Loki using its config file that I have prepared below (only two things need to change if you want).
docker run \
--name=loki \
-p 3100:3100 \
-v /volume1/docker/loki/local-config.yml:/etc/loki/local-config.yml \
grafana/loki
STEP02 - Config.yml sample
Use the following sample and change the http_listen_port and address parameter to match your needs.
auth_enabled: false

server:
  http_listen_port: 3100

ingester:
  lifecycler:
    address: YOUR_NAS_IP_ADDRESS_WHERE_LOKI_WILL_BE_RUNNING
    ring:
      kvstore:
        store: inmemory
      replication_factor: 1
    final_sleep: 0s
  chunk_idle_period: 5m
  chunk_retain_period: 30s
  max_transfer_retries: 0

schema_config:
  configs:
    - from: 2018-04-15
      store: boltdb
      object_store: filesystem
      schema: v11
      index:
        prefix: index_
        period: 168h

storage_config:
  boltdb:
    directory: /loki/index

  filesystem:
    directory: /loki/chunks

limits_config:
  enforce_metric_name: false
  reject_old_samples: true
  reject_old_samples_max_age: 168h

chunk_store_config:
  max_look_back_period: 0s

table_manager:
  retention_deletes_enabled: false
  retention_period: 0s
Note, that you will have to set the port number in the config file to match your docker run port parameter!
The address variable can be set to any local or public name, depending on where and how you plan on running your Loki instance. I have it running inside my LAN, so I will use my NAS IP address where Loki container will be running.
STEP03 - Start Loki
Compared to Promtail, this was short and easy. Fire up Loki and be sure to check that it is running with no errors in logs. Next, we will configure Grafana and connect Loki as a source. Hopefully, we will start getting some logs in.
Grafana - Docker setup
We are now ready to configure our presentation layer, Grafana. Nothing special here and the steps are almost identical as before.
STEP01 - download Docker image and configure the container
docker run \
--name=grafana \
-p 3000:3000 \
grafana/grafana
STEP02 - Connect Loki to Grafana
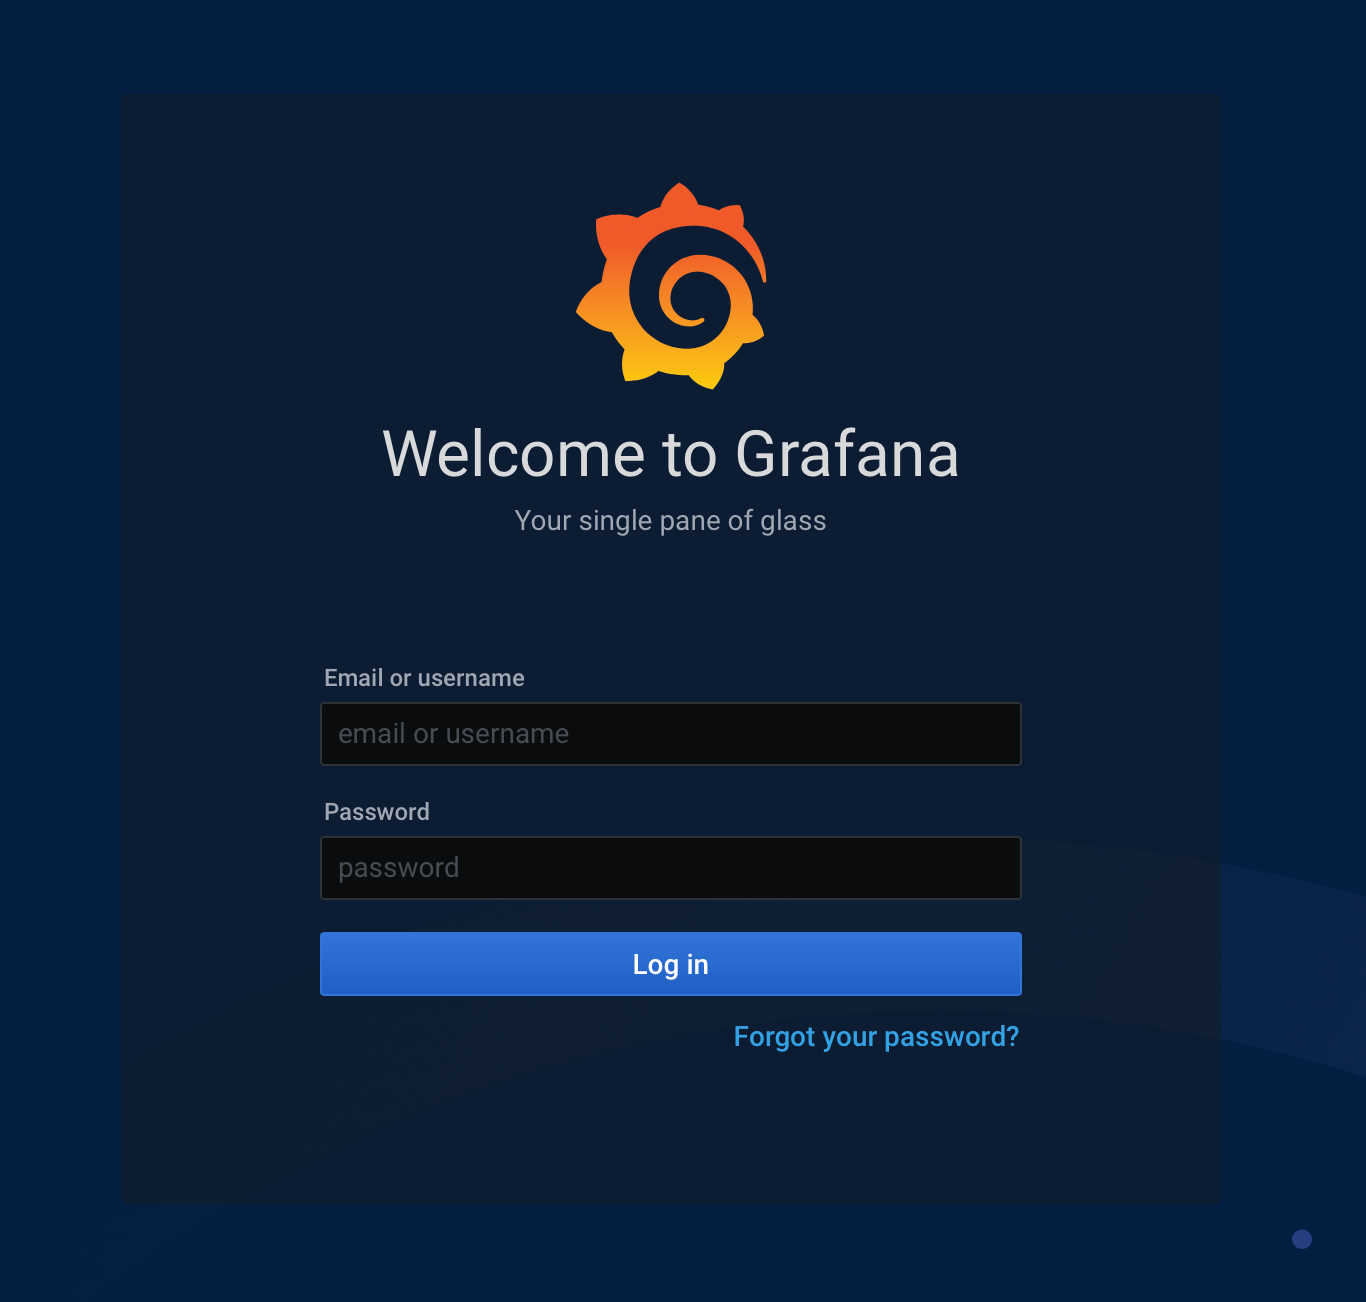
Log into your Grafana site by opening it on URL: http://yourNASip:3000 and logging in using admin as your username and password (you can change it afterward).
After you have logged in, use the menu on the left-hand side and locate Configuration > Data Sources. That will lead you to a page where you can connect Grafana to any number of potential sources, like Loki in this case.
Click on the blue Add data source button, and you will be presented with the following page.
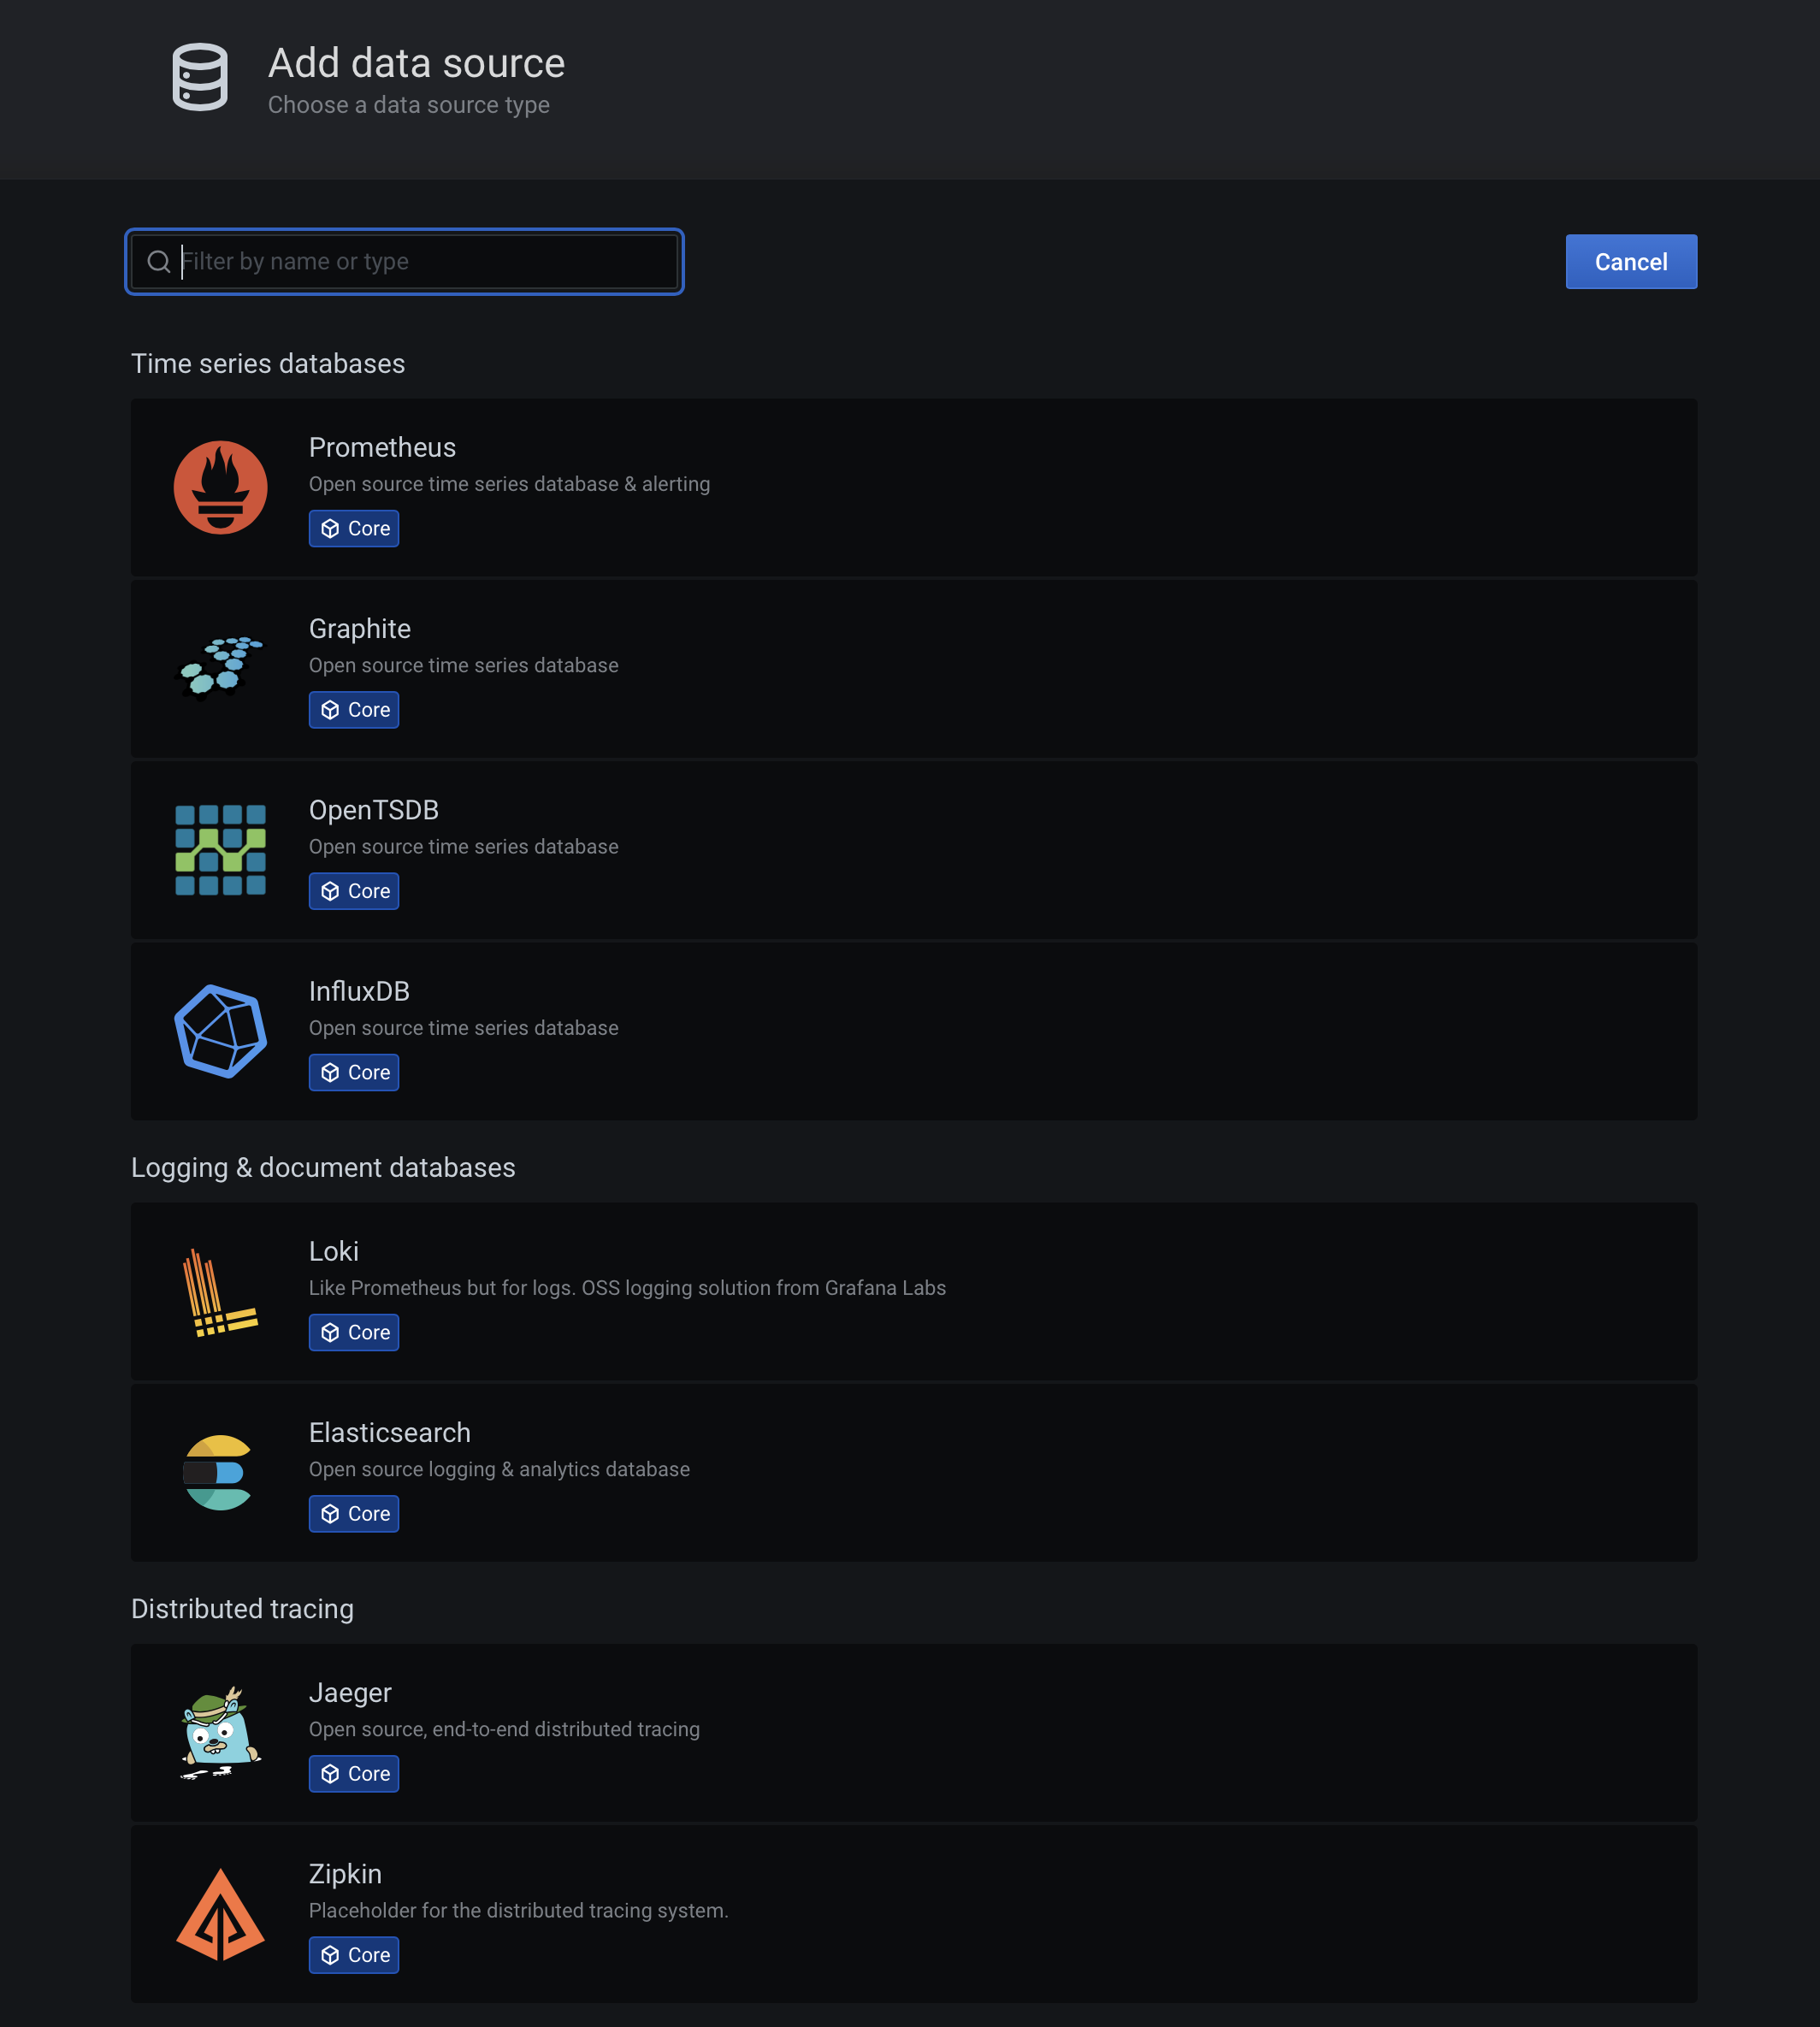
In the list under Logging & document databases find Loki and click on it. You will be presented with the following screen that you need to configure to connect to your running Loki instance.
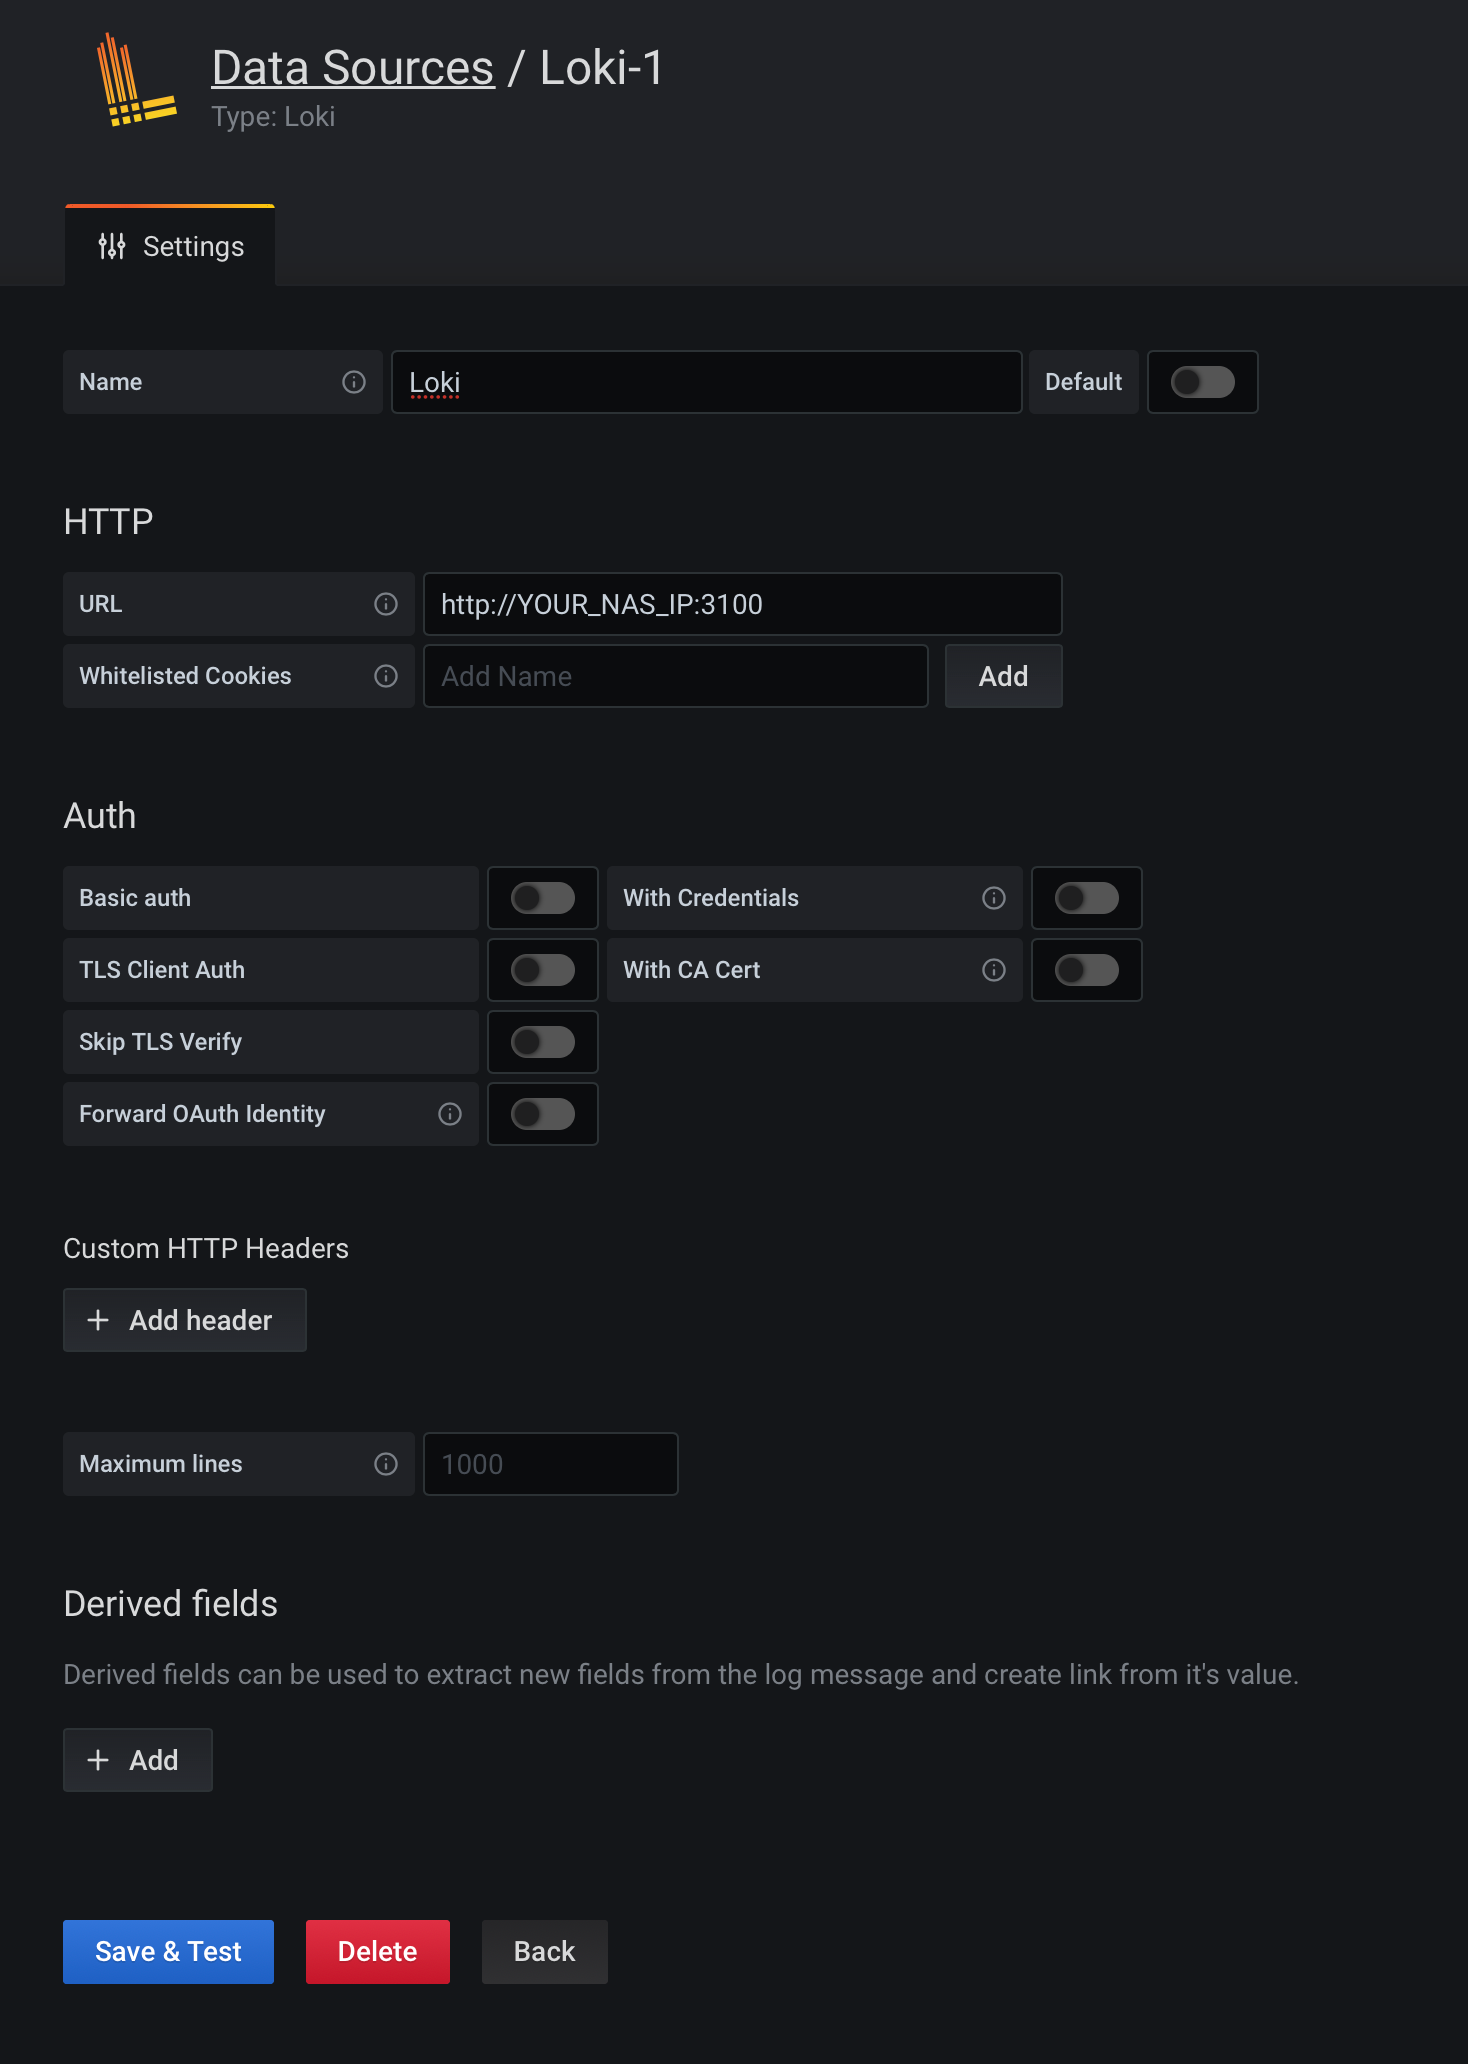
Enter your Loki URL parameter (http://YOUR_NAS_IP:3100), a description name on the top, and leave everything else to default as it is.
Finally, click on the blue Save & Test button, and you are done!
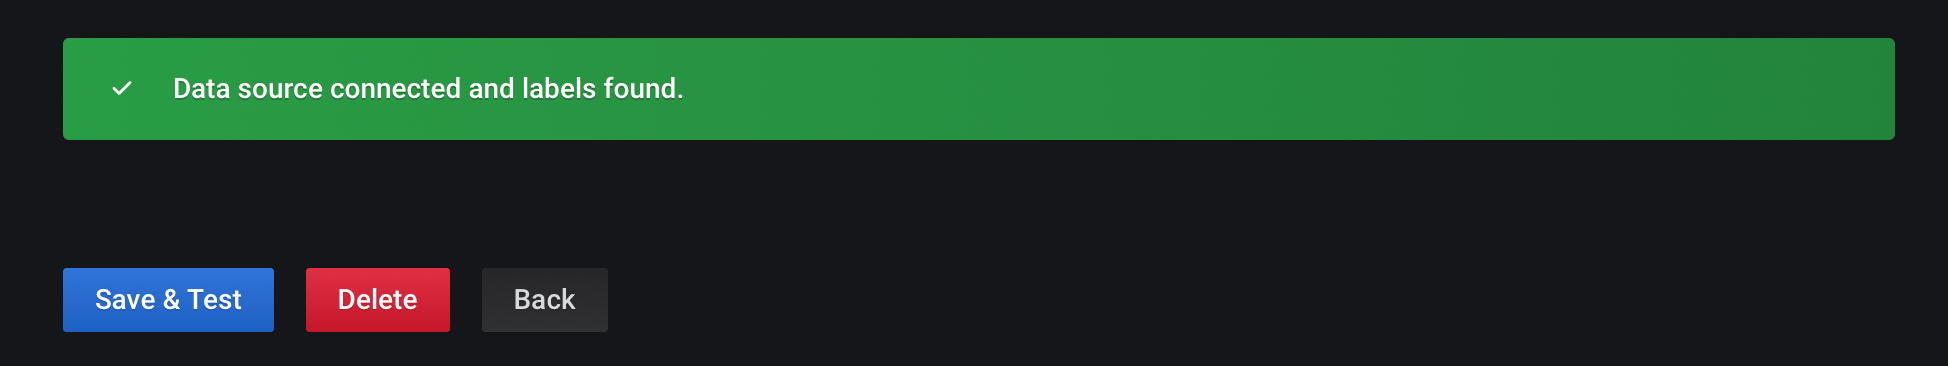
NOTE: Wait for the green confirmation label on the bottom! This will tell you that Grafana can talk to Loki without any problems.
In case you get a red warning: "Loki: Bad Gateway. 502", means that Grafana is unable to talk to your Loki instance.
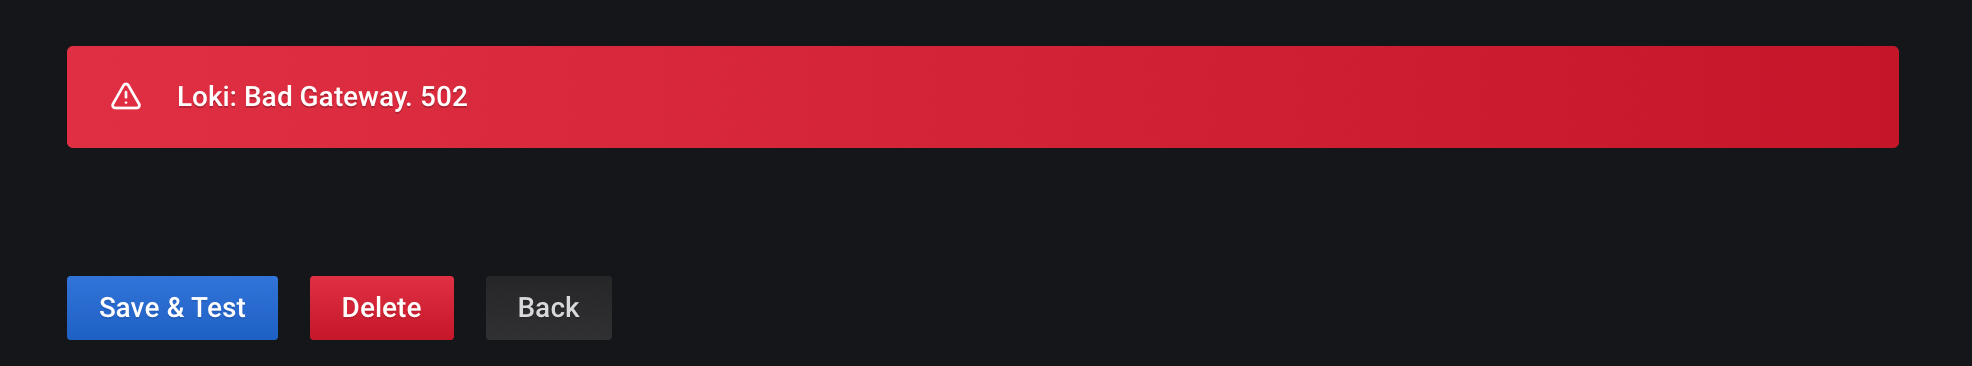
There are several reason for this:
- Check if there is a firewall preventing your Grafana instance to talk to Loki
- Check if there is any other network problem that might prevent Grafana and Loki to talk to each other
- Check if you have entered the correct Loki URL
- Check if Loki is running at all
- Check if Promtali is running and pushing out logs to Loki
In any case, if you are green, that is great. Time to check out some logs!
STEP03 - Check your logs using Grafana Explore mode
Unlike accessing Grafana the way most people do, by accessing their dashboards, looking at logs you will use the Explore button in the Grafana menu.
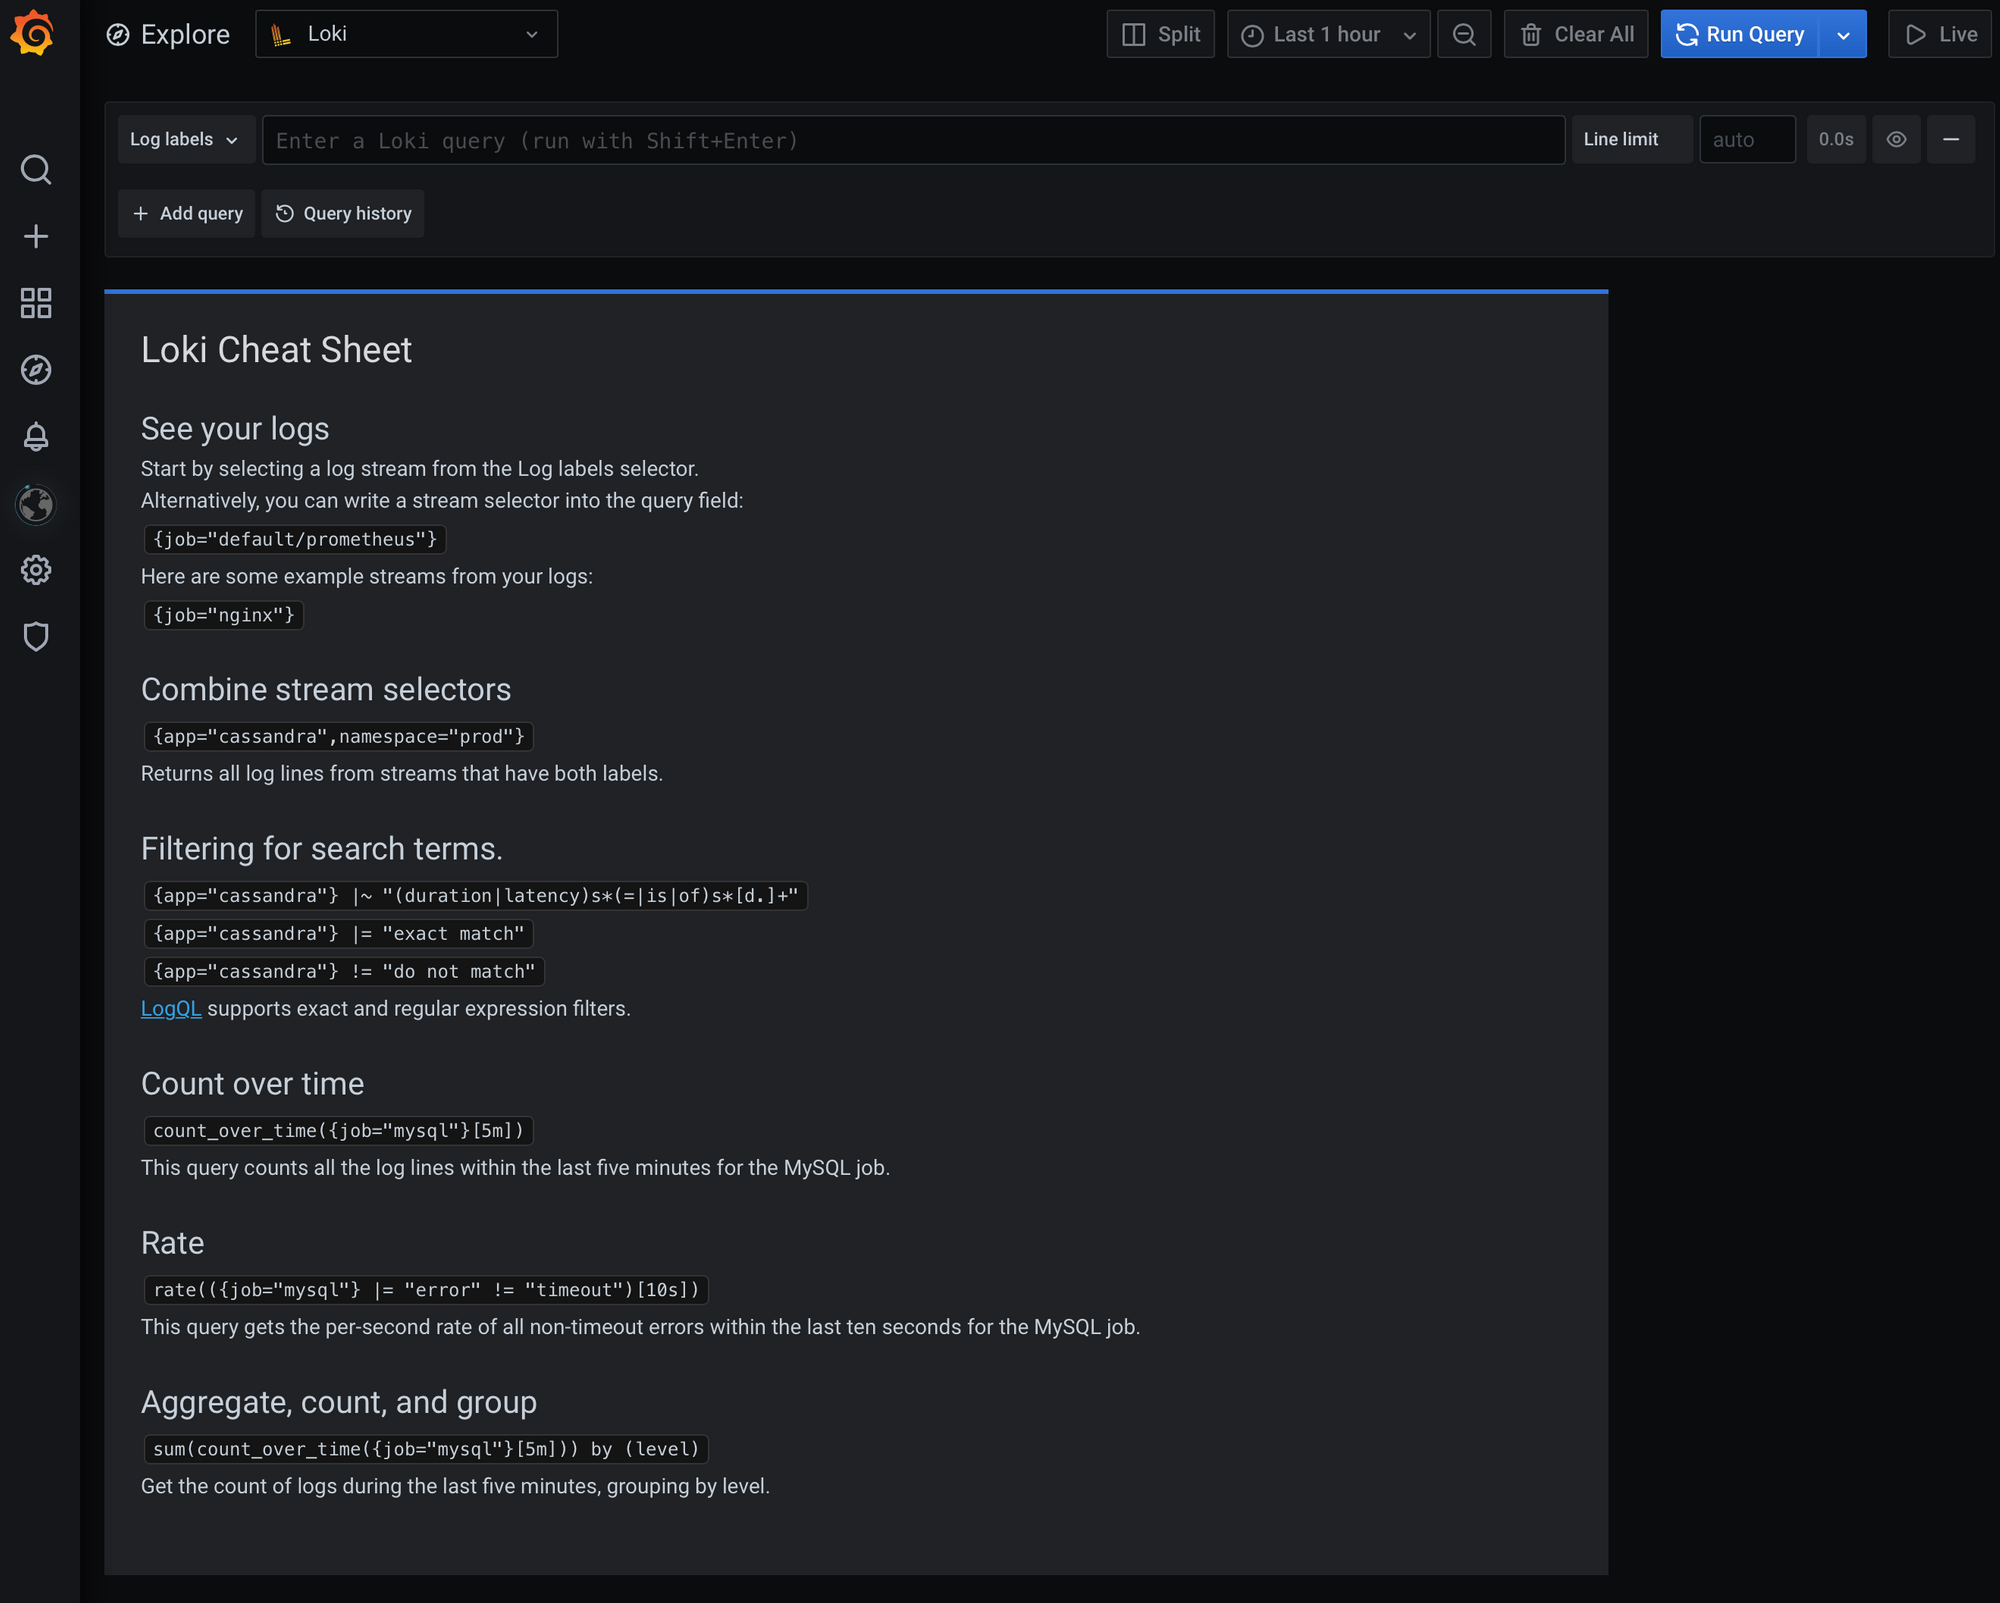
From the top-left dropdown menu, select Loki (if it isn't already) and you are good to go.
The way checking logs works is that you will have to write some sort of query in the text box saying "Enter a Loki query".
That is one way, another is that we can use Promtail labels that we have defined before. So, find the Log labels menu (left from the text box) and select one label that you want, let's say, /var/log/messages in my case.
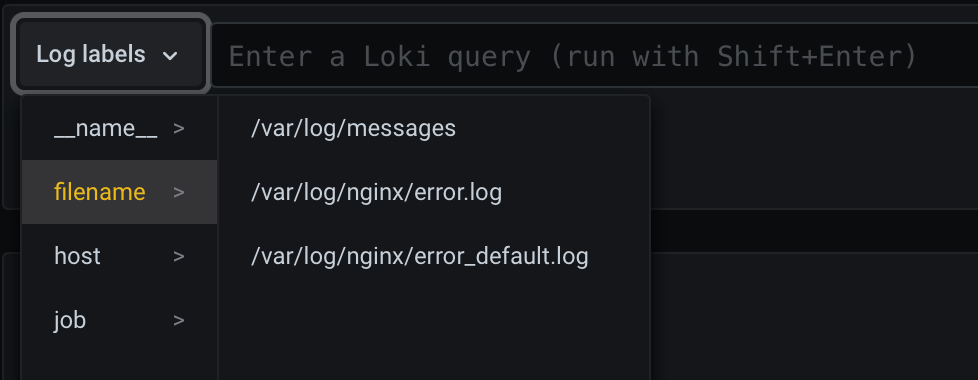
Clicking on the label value, you will get a query listed and executed. Now, don't worry if you don't see anything on the list, it can mean that there are no entries for that time.
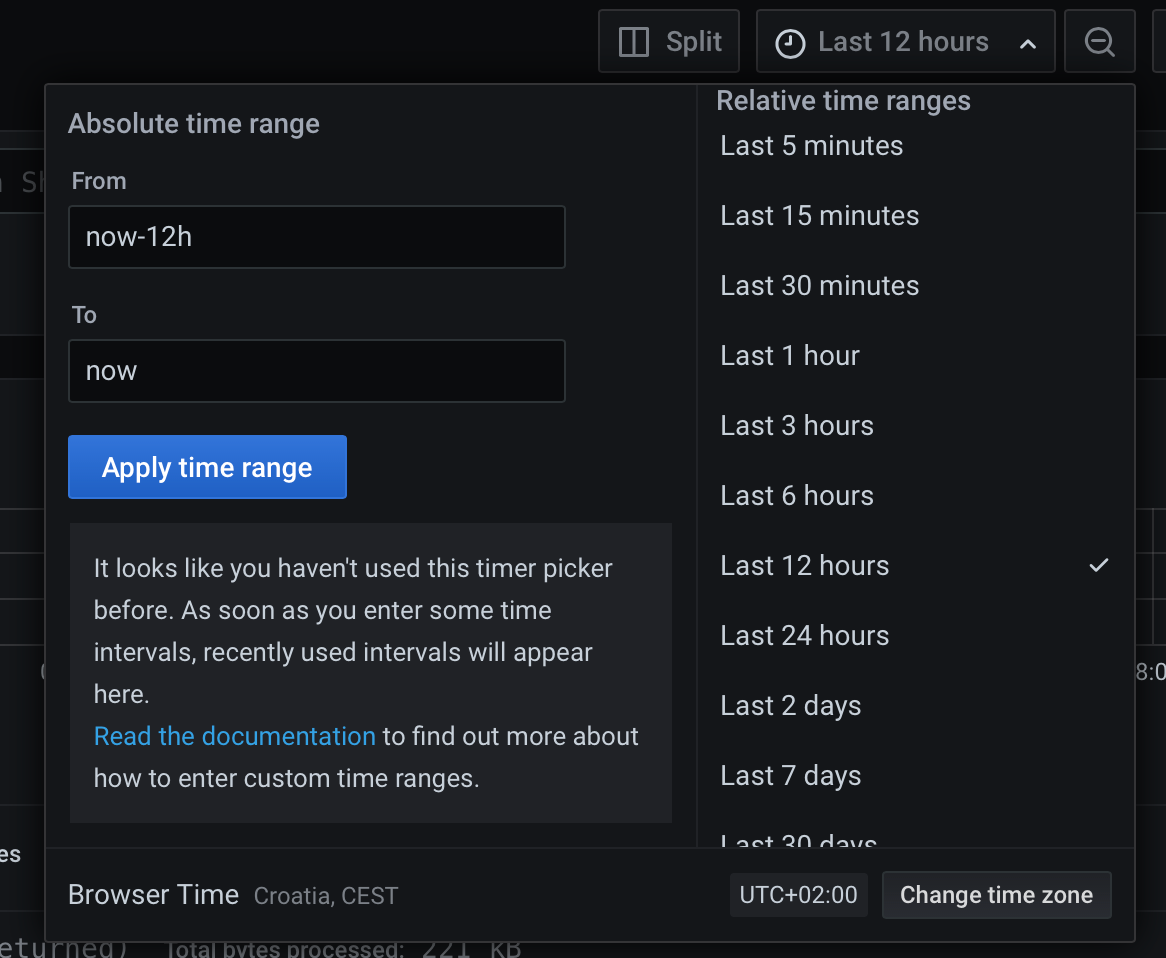
On the top right side, you will notice a menu with the options to select a period. Just select something longer than let's say 6 hours and boom, you should get some results.
Finally, the end result will look something like this:
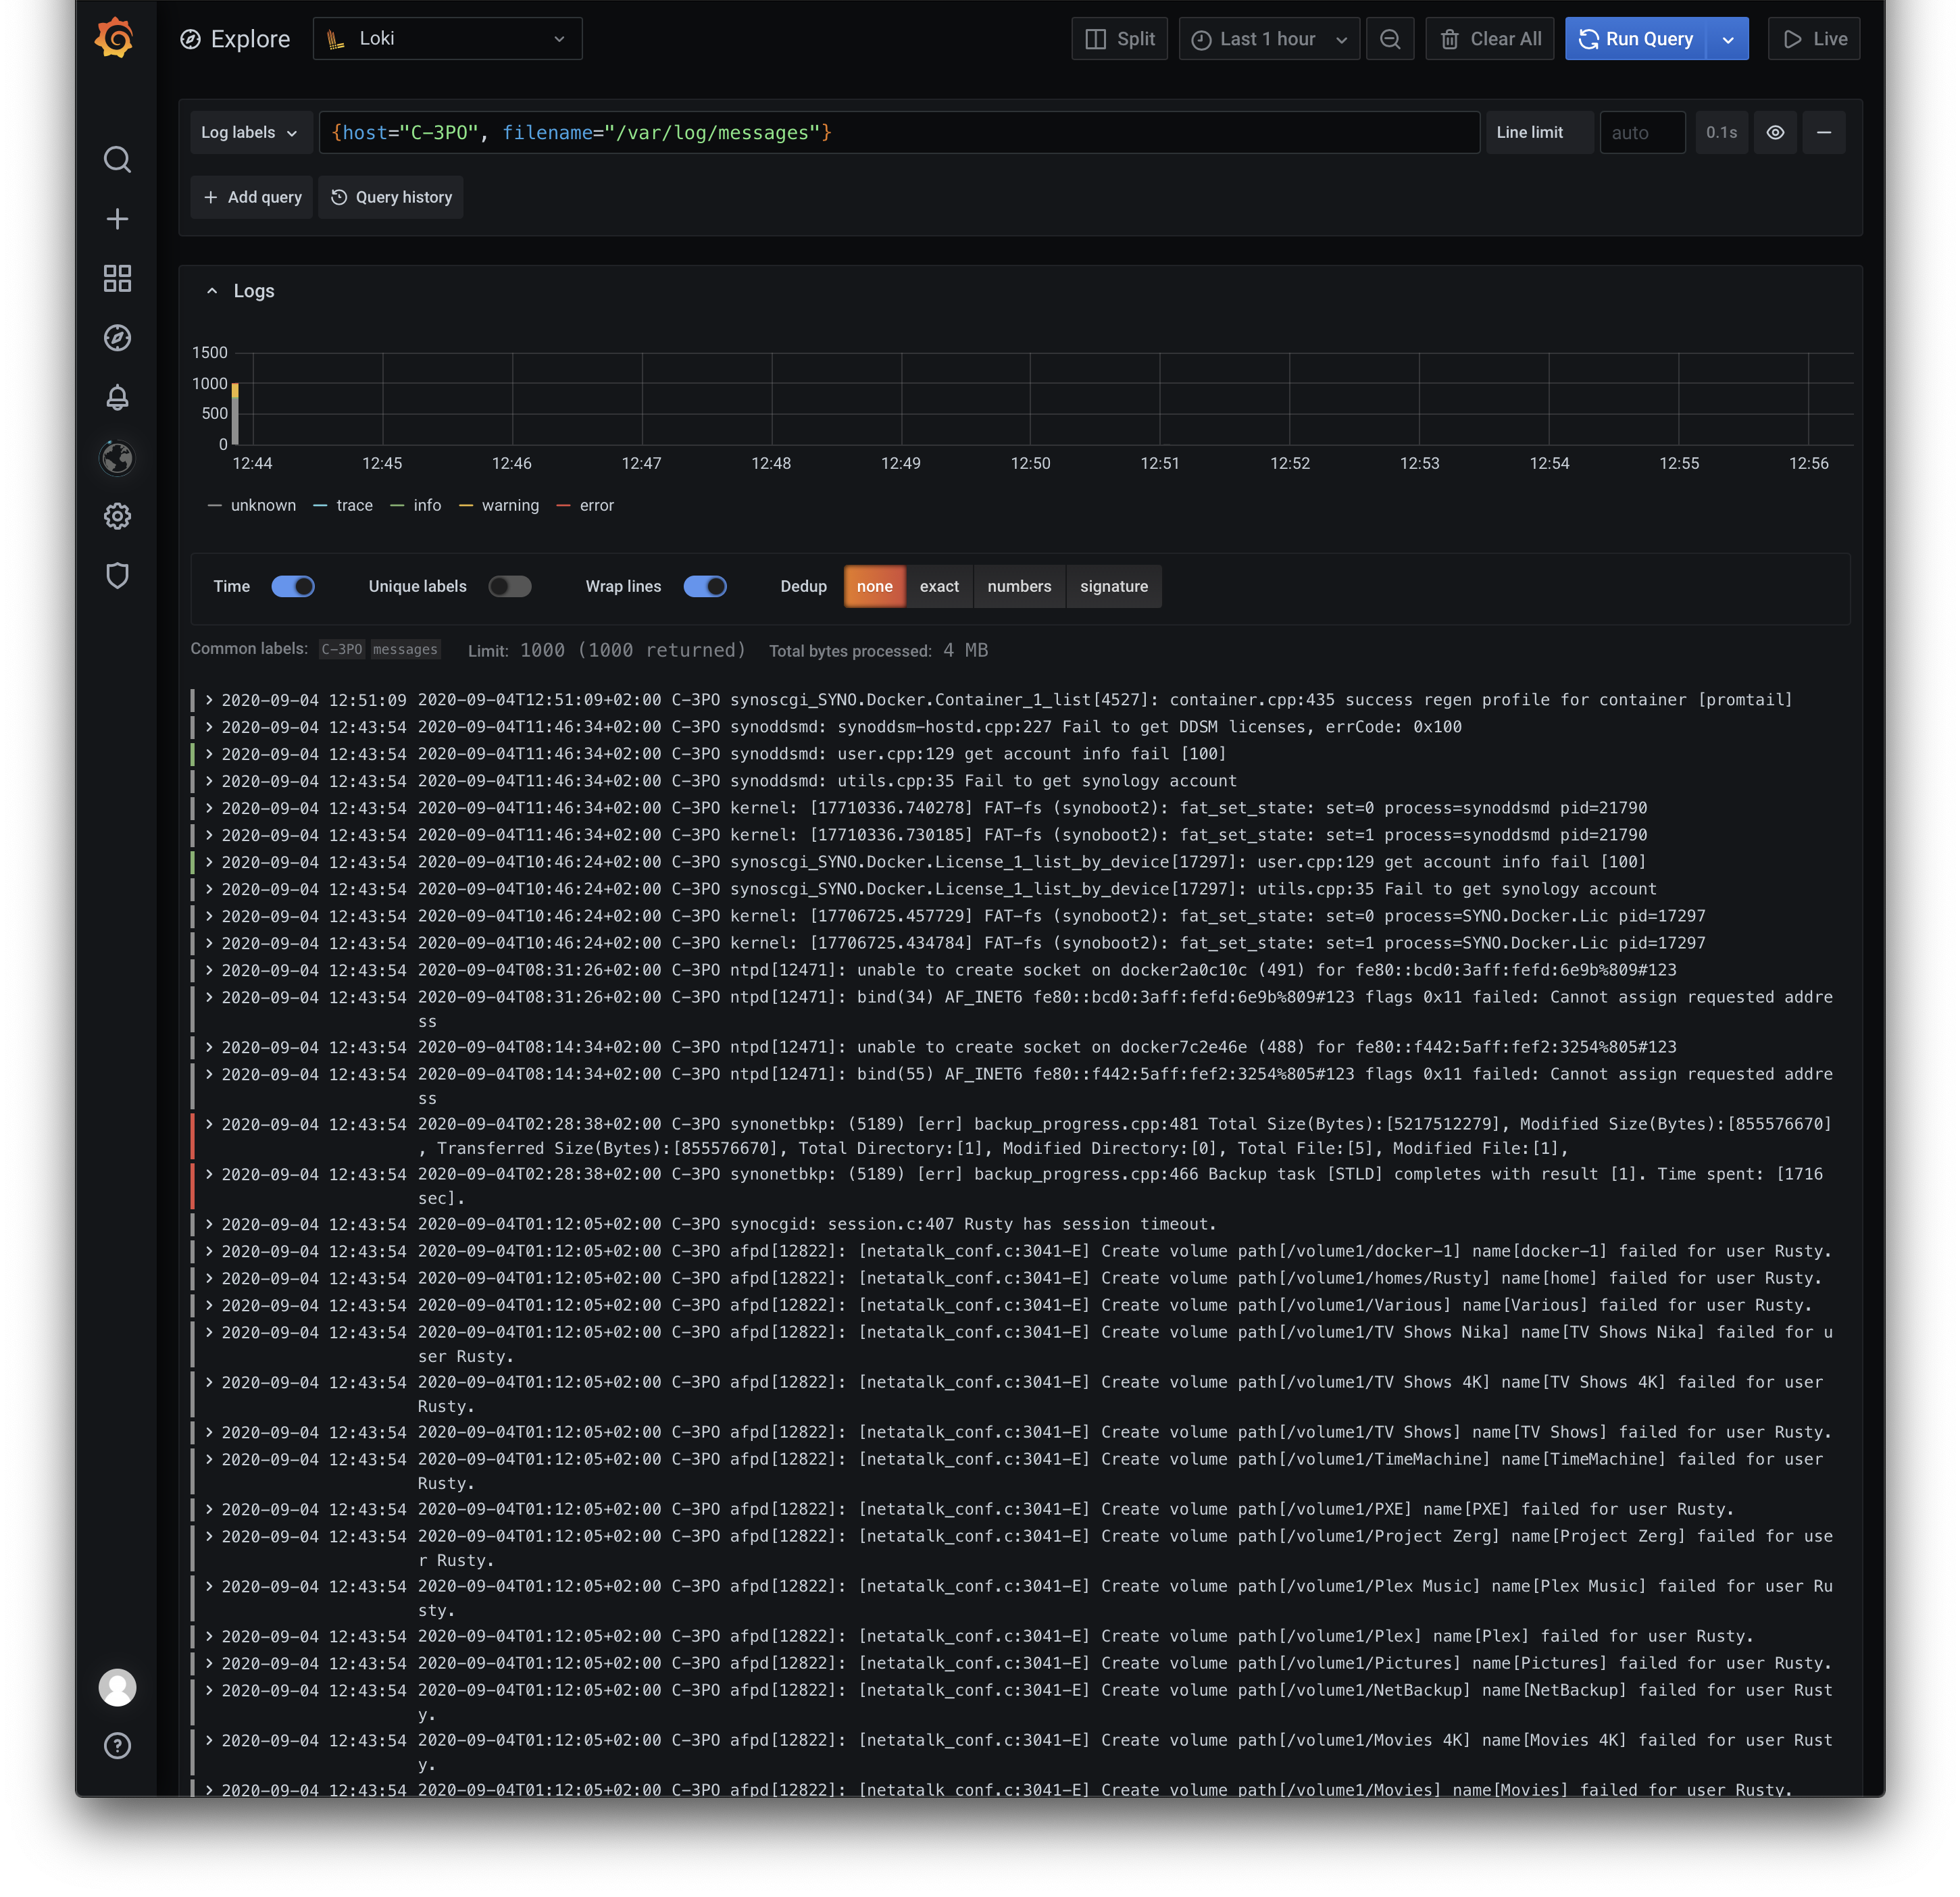
Also, you can use the split view button to compare two logs side by side
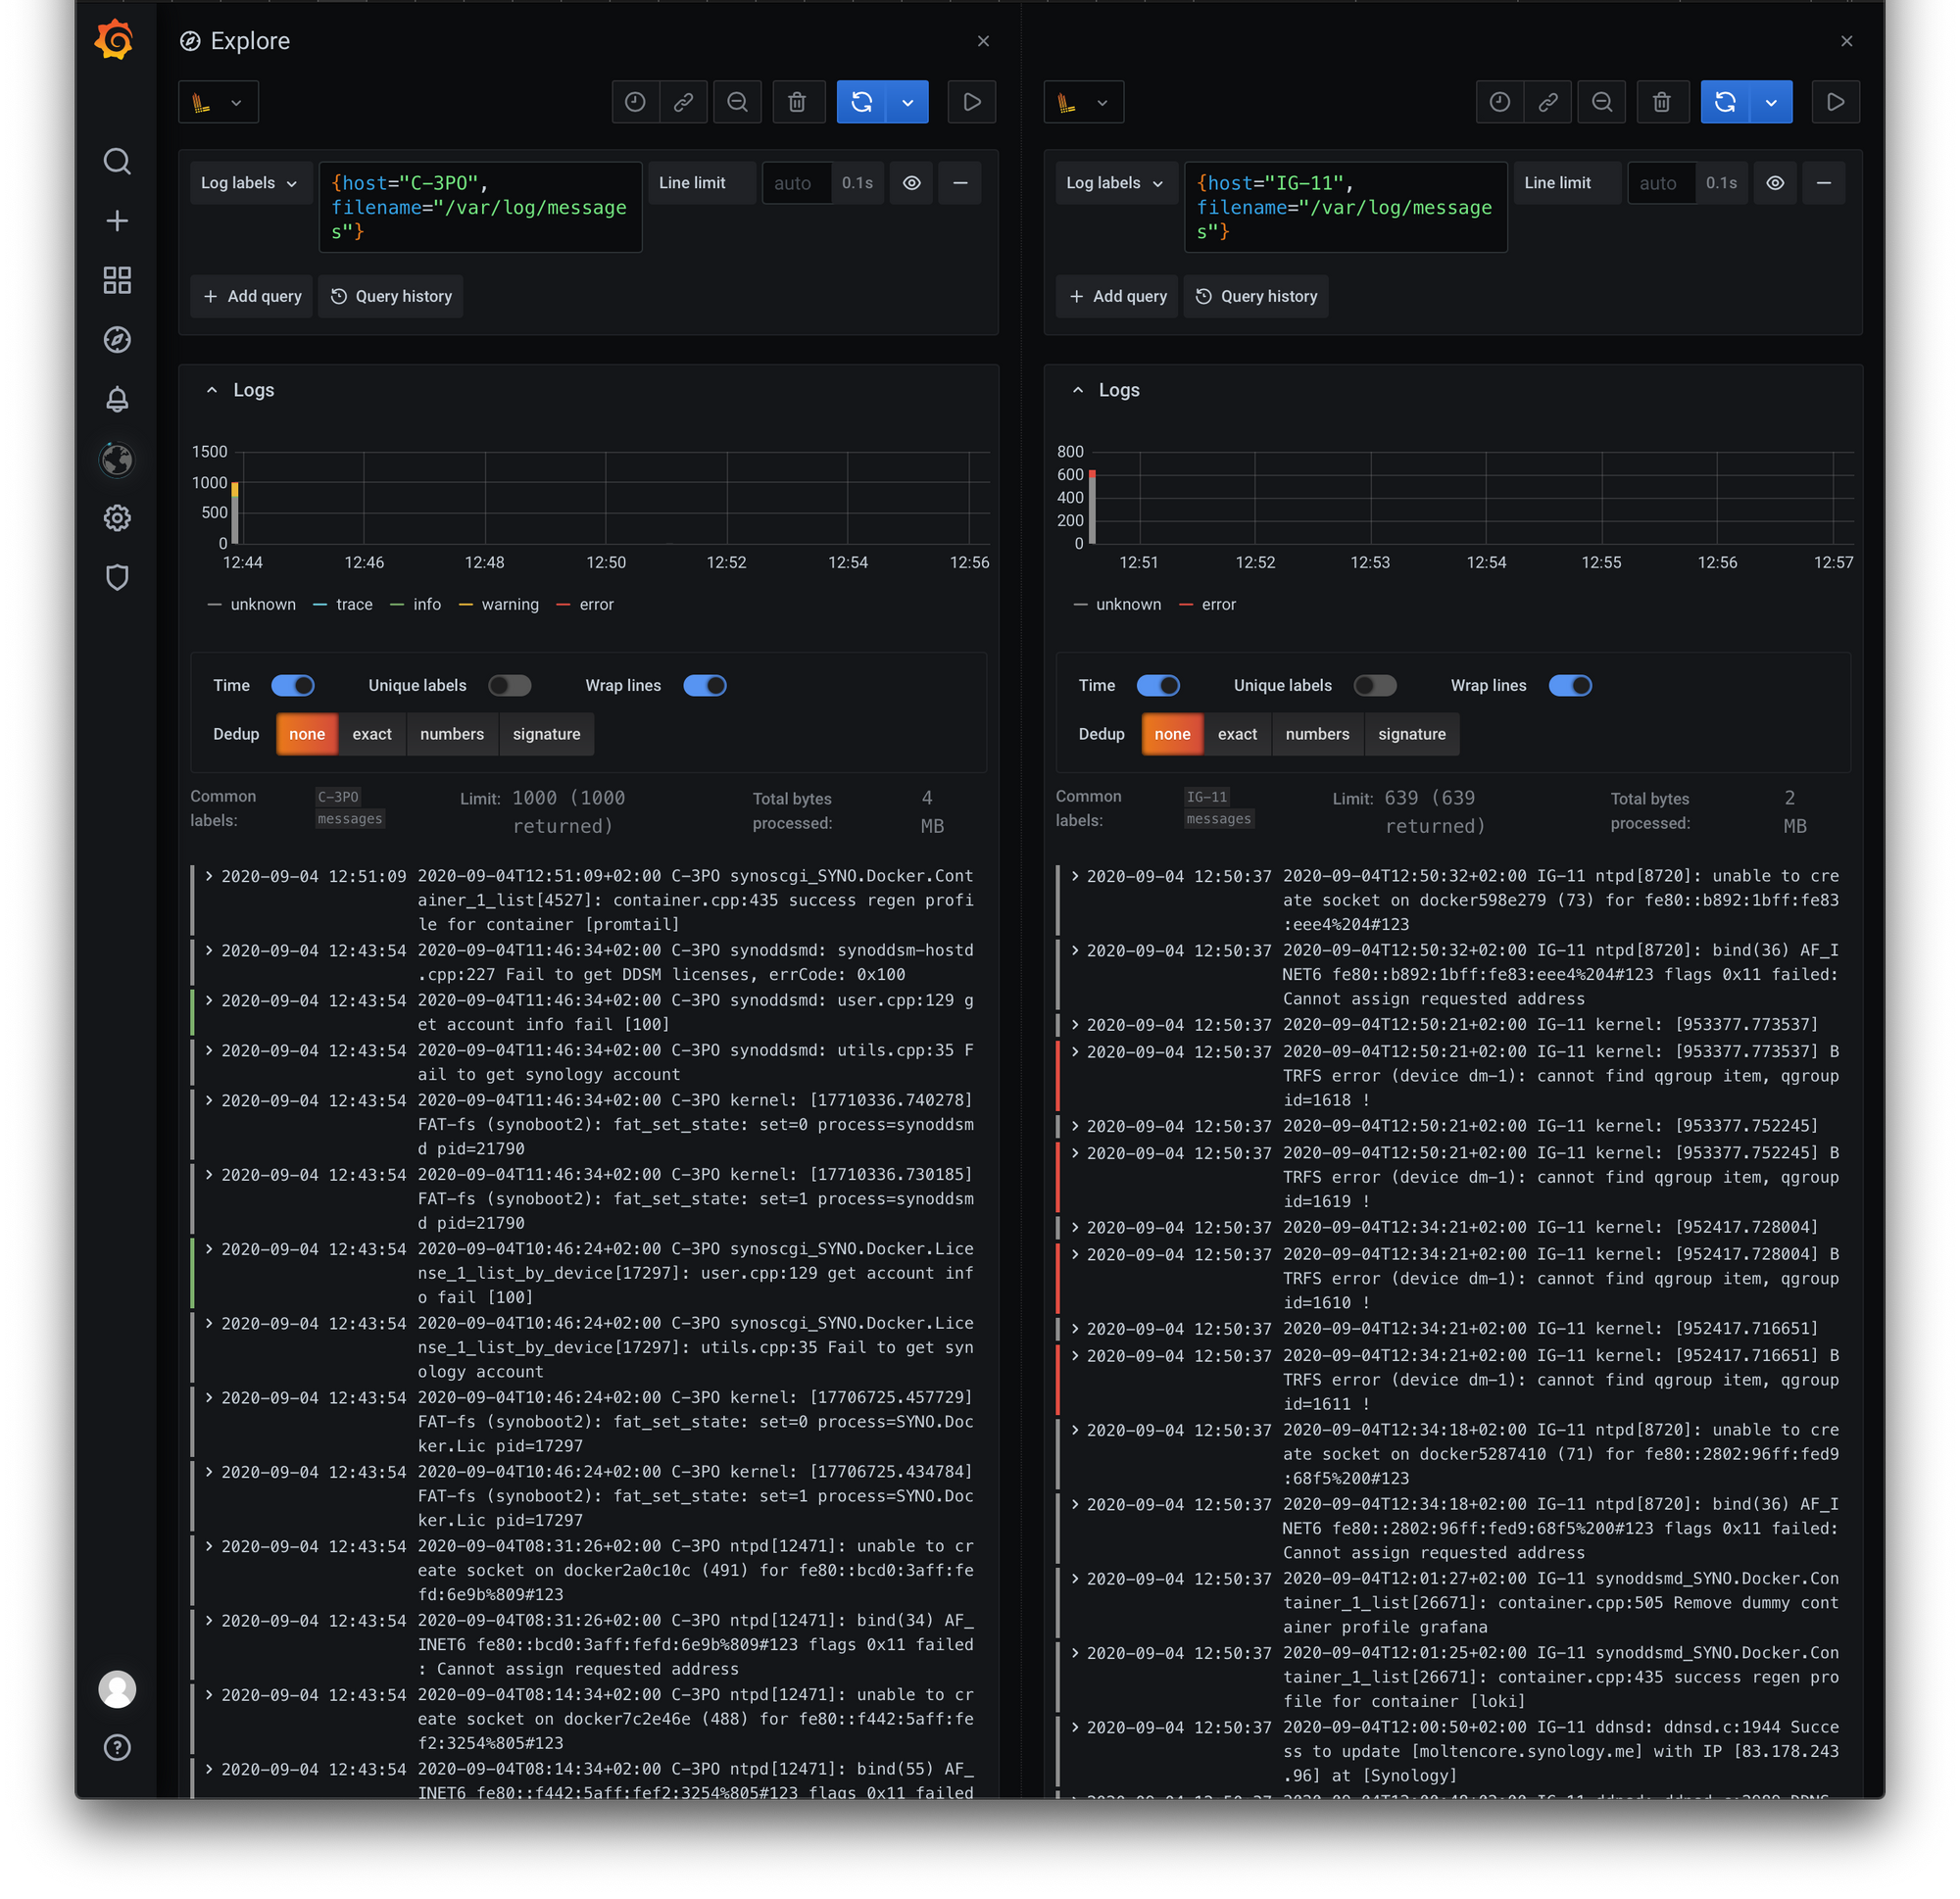
There are now options and query functions that you can use to filter out your logs, get context view, and much more, but that is material for another article.
Hope you have found this article useful and helpful. As always, let me know down in the comments what you think, and if you have any questions, please do ask.