docker View Docker HUB repository statistics using Grafana and Infinity Over time, I tend to write about Grafana Labs products, and today I would like to just point out one plugin that I found out while researching how to implement
docker Grafana 8 - InfluxDB 2 - Telegraf - 2021 monitoring stack Table of Contents InfluxDB 2 Docker container Configuring Telegraf token in InfluxDB instance Configuring and connecting Telegraf to InfluxDB Telegraf Docker container Grafana Docker container Connecting Grafana to InfluxDB Examples
docker Loki - log aggregation platform from the creators of Grafana UPDATE: 12/05/2021 - Grafana 7.5.x supports new Loki log browser that will assist you with selecting labels and creating queries. UPDATE: 29/09/2020 - After
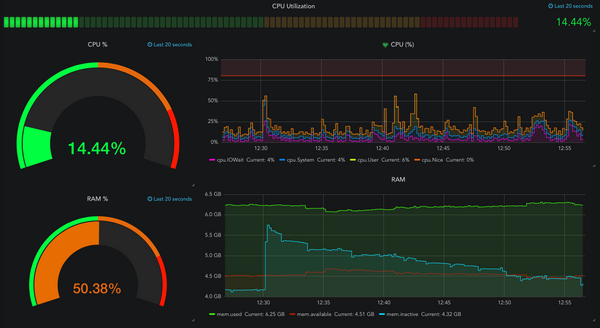
docker Grafana dashboards and upcoming v7.0 Almost a year ago I wrote on how to setup Grafana via Docker on your Synology NAS using a popular GIT configuration (Grafana + InfluxDB + Telegraf). In that same article I
docker Grafana - InfluxDB - Telegraf (GIT) monitoring setup via docker UPDATE: 11/06/2021 - I have added a new article with the up-to-date version of this stack. The new stack uses the new InfluxDB 2.0+ so be sure