Grafana dashboards and upcoming v7.0

Almost a year ago I wrote on how to setup Grafana via Docker on your Synology NAS using a popular GIT configuration (Grafana + InfluxDB + Telegraf). In that same article I haven’t posted any pictures or dashboards that I use daily.
Many things have changed in the past year regarding my Grafana usage but for the most part I use custom defined dashboards that show what matters to me most at any given time.
True, some dashboards that people use require a lot of time and effort to setup, certain steps that might include multiple sources, multiple variables and in the end they get an awesome looking dash.
For me, in the future, I can imagine that this will be less needed if Synology DSM 7 Active Insight feature will work as intended. But, for now, here are just several dashboards that I personally use to monitor my multi NAS configuration.
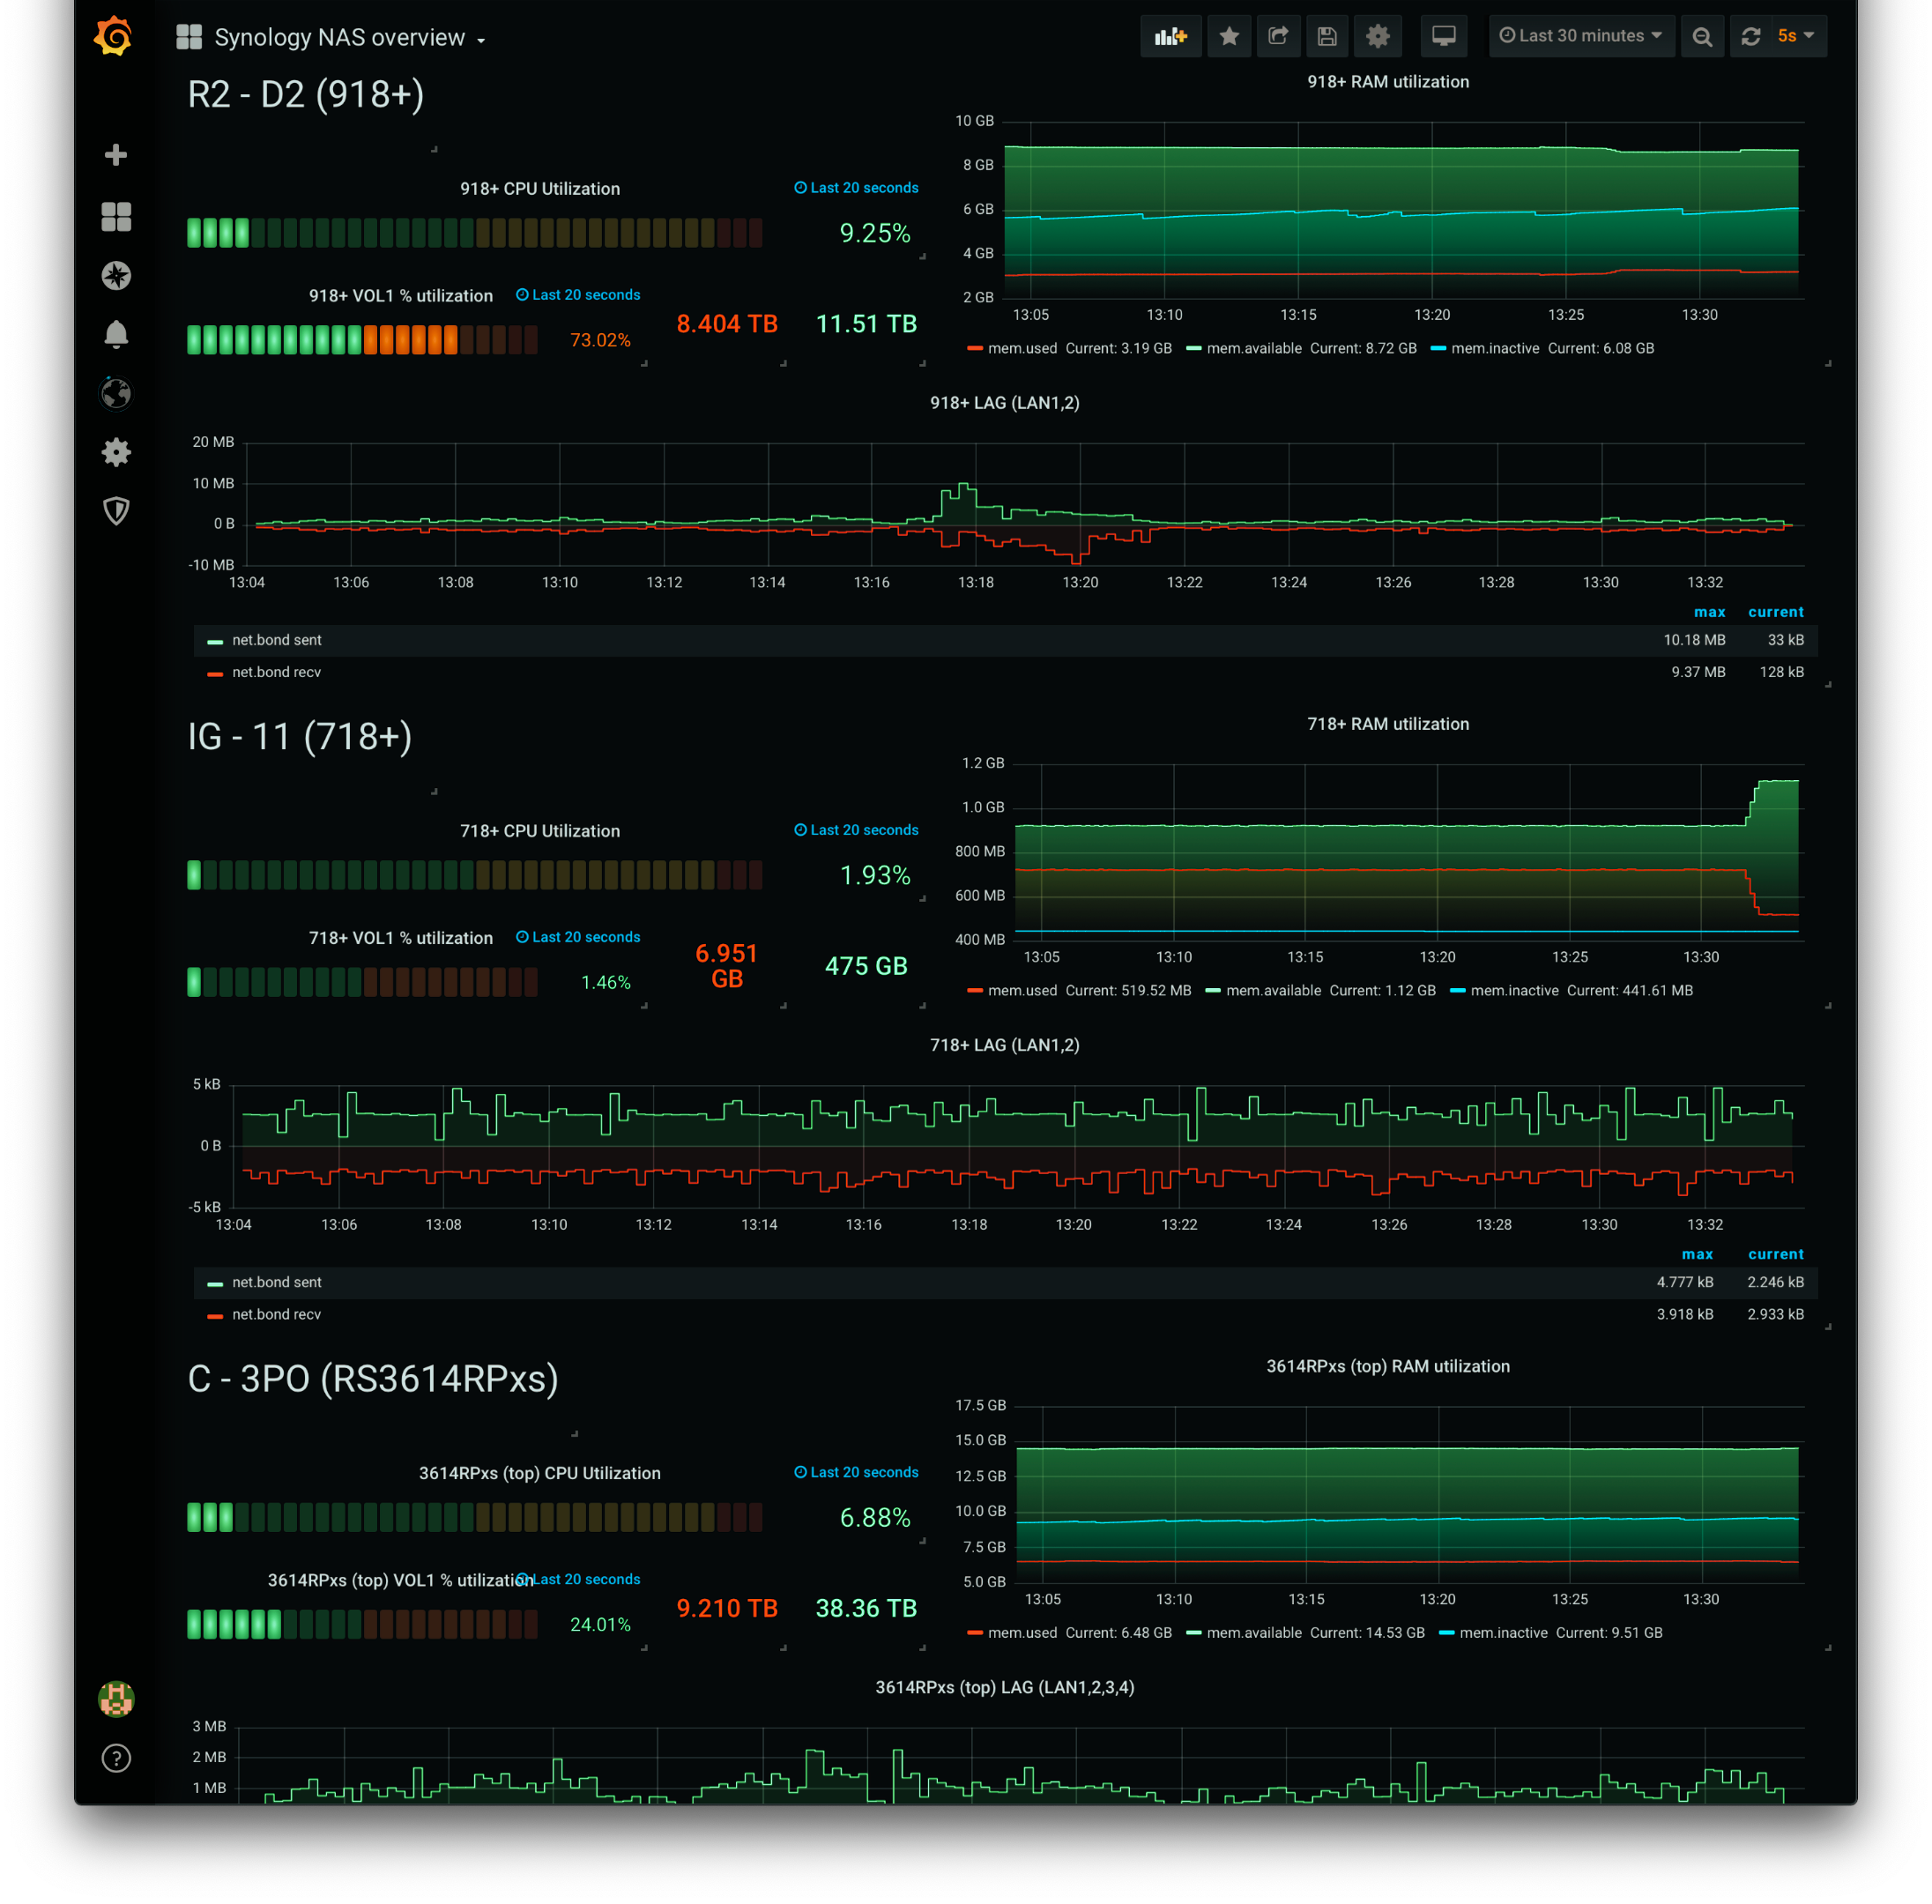
01. NAS overview dashboard.
This dashboard is a presentation (not fully visible) of my onsite NAS devices and their main categories: CPU, volume/pool, and RAM utilization as well as network bandwidth (up/down).
It is a bit tight (I could play a bit with some dividers a bit more to make it less crowded), but for me it’s a single dash where I can immediately see if there are any problems with any of my NAS devices.
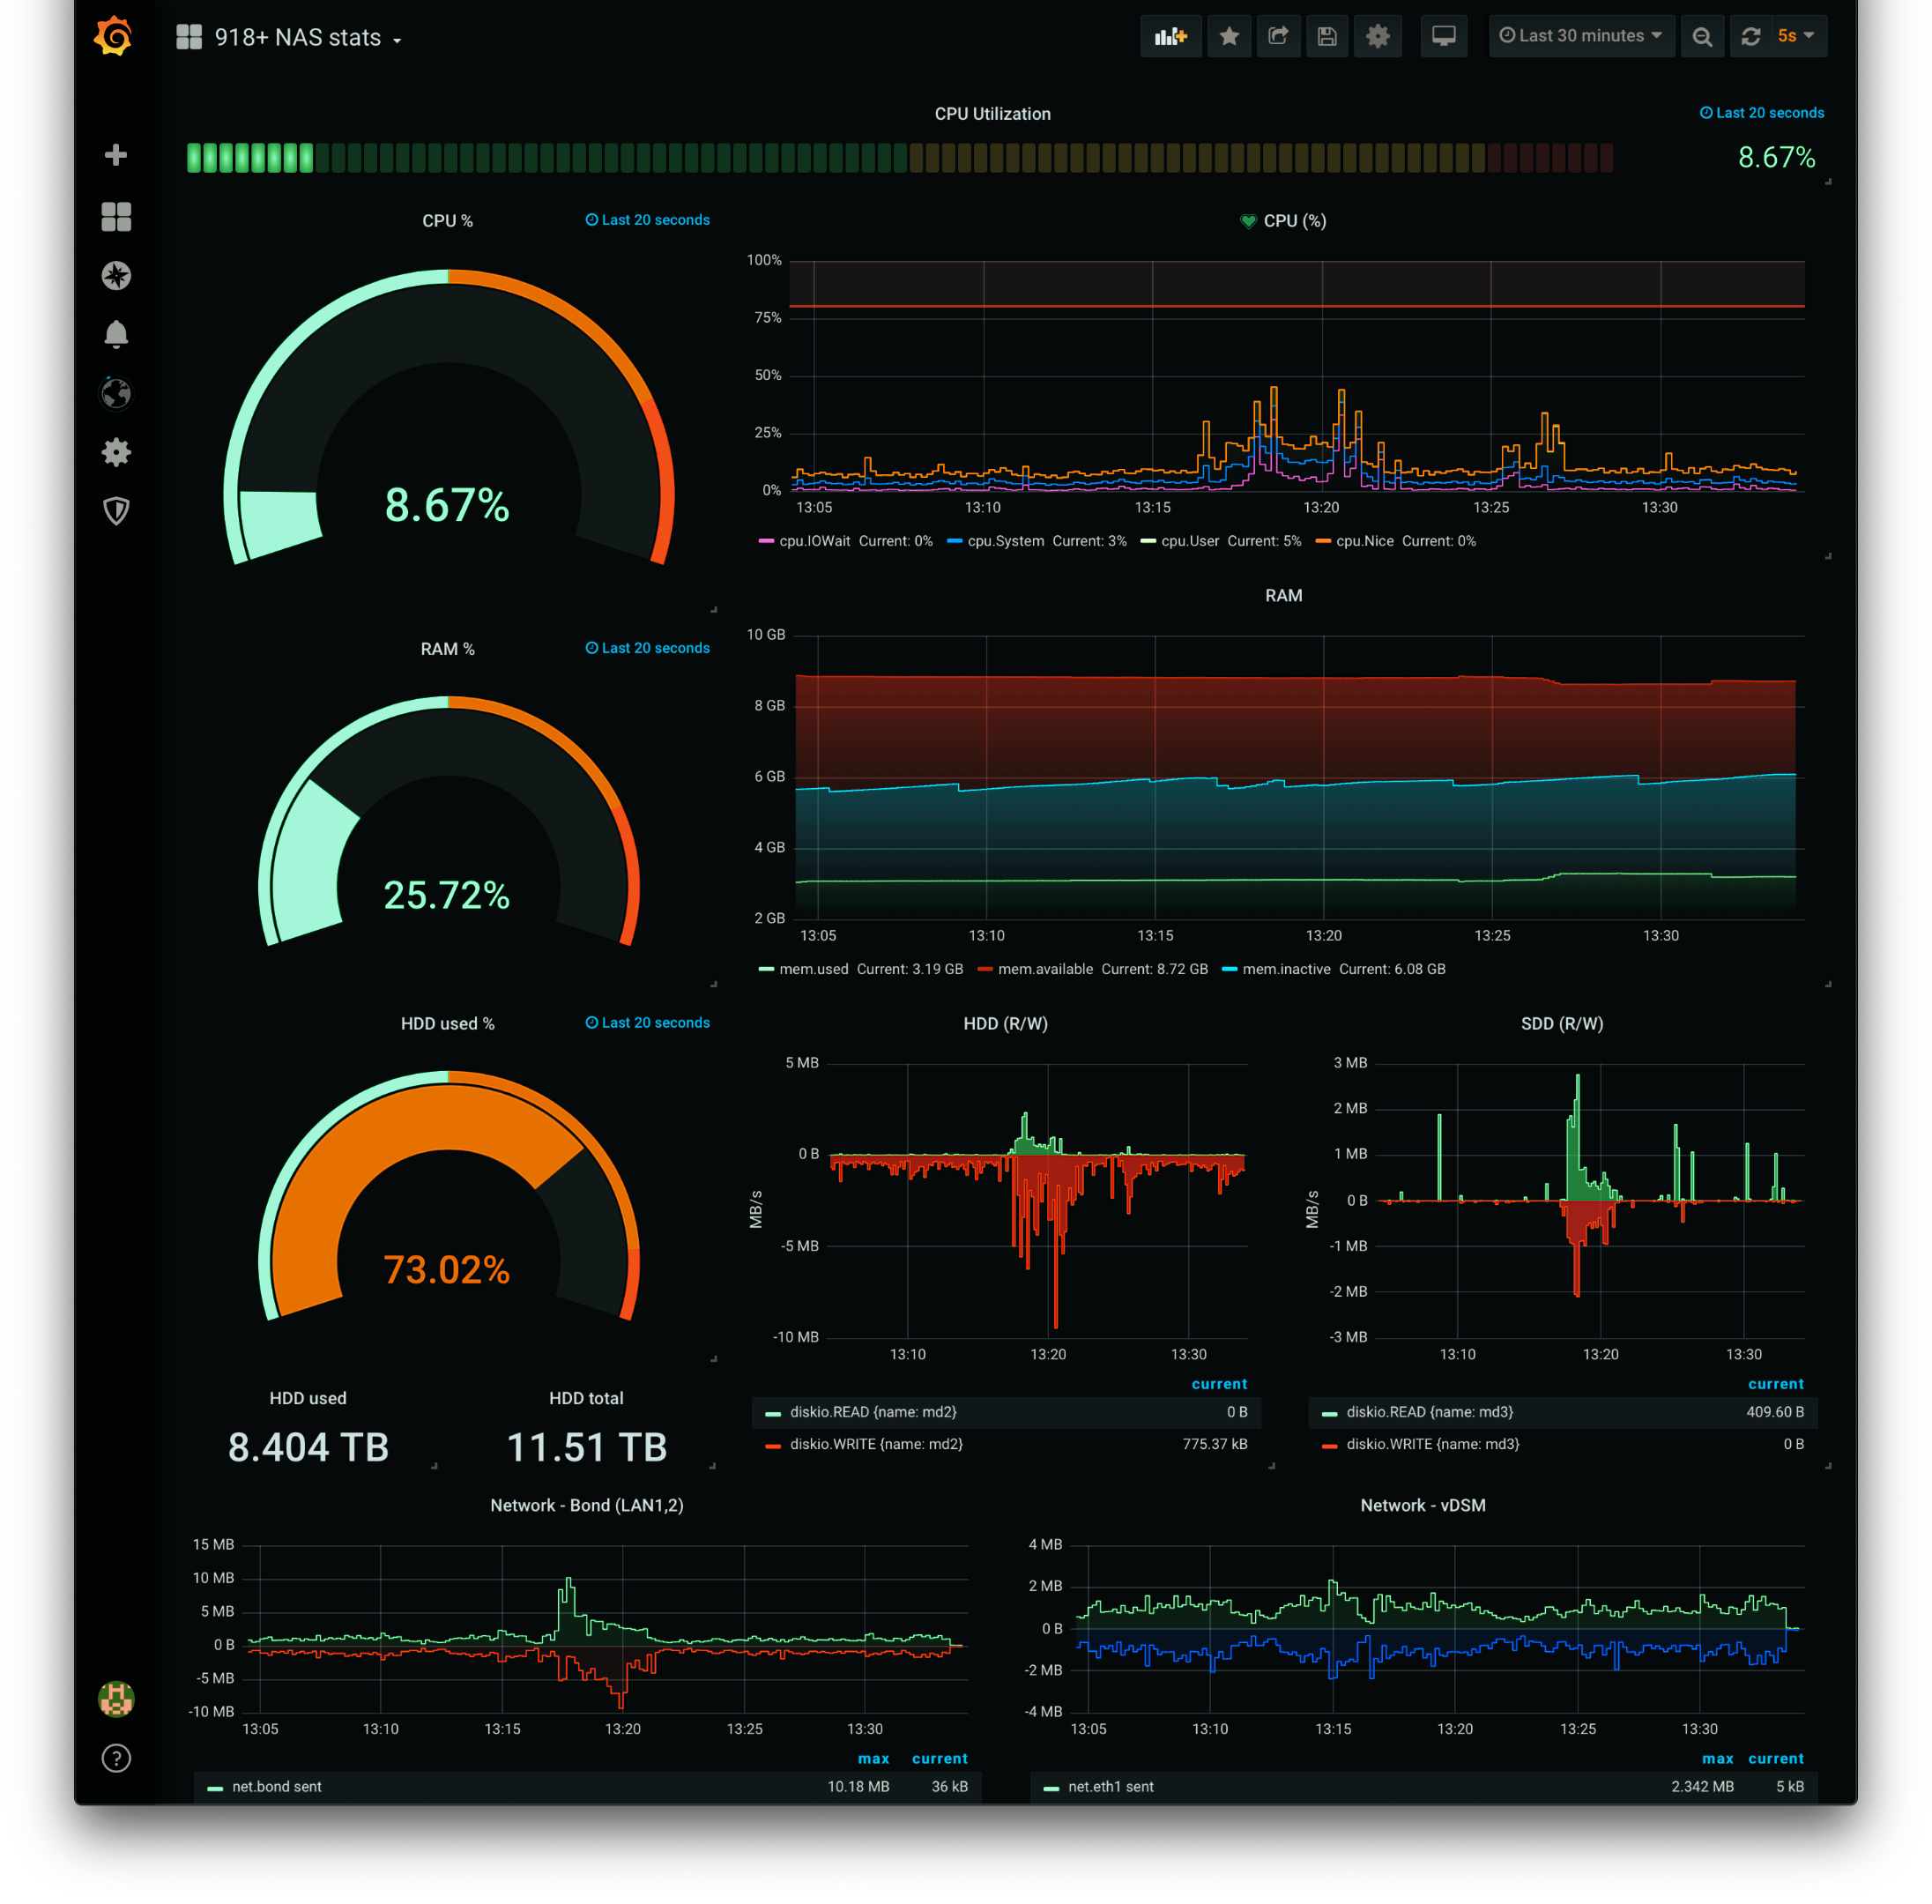
02. NAS specific dashboard
In case that there is something specifically going on with a certain dashboard, then I use this one. Here are a few more details that might give me more info on the problem (like a more detailed CPU graph and volume R/W operations). All of my dashboards are, by default, set to 20sec refresh per panel and 30min for the whole dashboard.
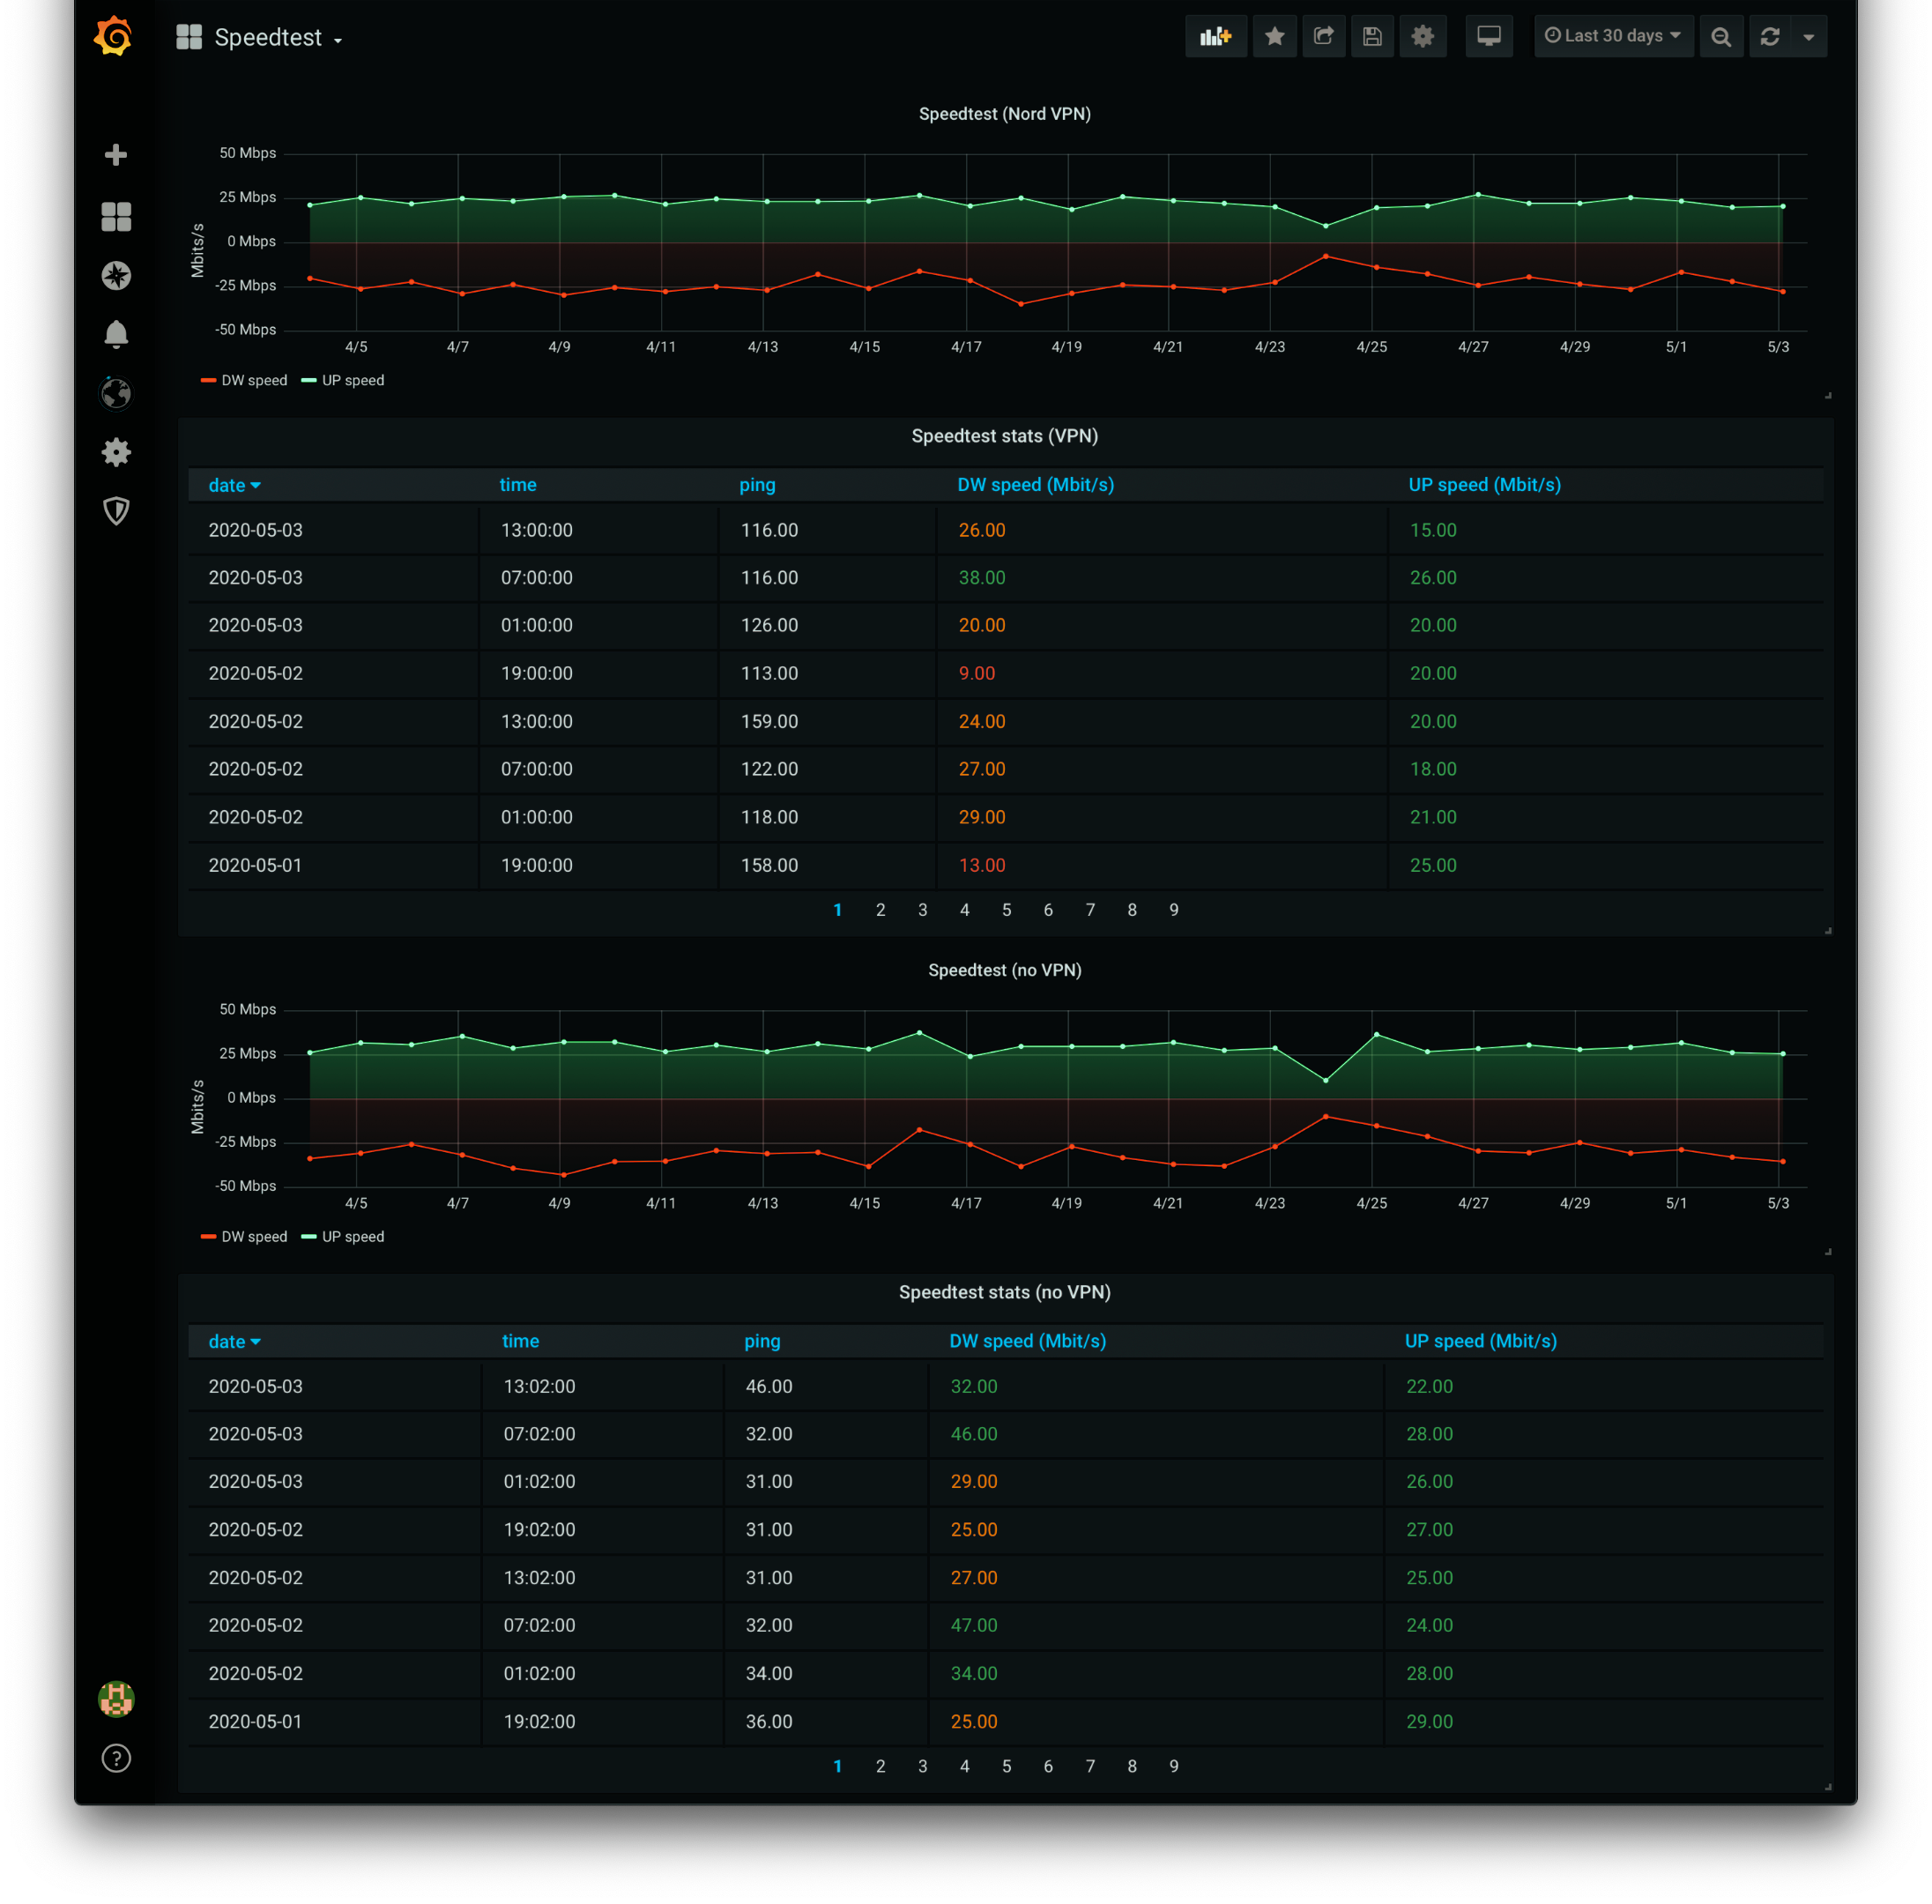
03. Speedtest dashborad
Now this little dashboad is a combination of some speedtest cli script results that are loaded into a small mysql database and presented here. Sure there are some high end speedtest dashboards out there that do require some more modules, but I have found that this solution works just fine for me. Considering that I’m not on the fastest or most stable connection right now (come on fiber!), and that my ISP tends to say there are no problems when they do occur, I was forced to keep a history of my speeds as evidence from my user experience side. I run a full VPN LAN setup and so this dash represents speeds every 6h for an encrypted and unencrypted traffic.
On top of these , I have a few docker specific and other web oriented dashboards but for the most part I use in total of 3-5 dash daily for all my Synology needs. Benefits of having these dashboards is that in comparison with Synology Resource Monitor I have a single birds-eye view that is more informative and faster then RM. Also I can see whats going on before I even log into any of my NAS units.
DSM 7 has some RM changes coming along but I personally don’t expect much as oppose to Active Insight that will be free and, again, possible change of my onsite Grafana needs.
Grafana v7 - incoming
In two weeks time (18th of May) we will get a new version of Grafana, v7. If you want you can test it right now as a beta 1 version. There is a ton of changes and features coming so I won’t get into them now. When v7 hits I will of course update to it and post back if there will be any major changes that are beneficial to my usage.
In all, Grafana is a great presentation tool and even though it takes some time to setup and configure in the long run it will be worth it, trust me.