View Docker HUB repository statistics using Grafana and Infinity


Over time, I tend to write about Grafana Labs products, and today I would like to just point out one plugin that I found out while researching how to implement a specific solution.
The idea behind this article was simple. How to get a Docker repository statistics into Grafana. What I wanted to have was a more exact overview of Docker image pulls for my Midnight Commander image.
While back I made an image as I wanted to have MC as a Docker solution in case DSM 7 starts causing problems with installing it on bare-metal. More info on it is in the following article.
The problem with Docker stats is that the pull counter has specific milestones when it changes the label. So once you hit 10K pulls, 50K, 100K, etc you get a new label, but values in between are not presented. I simply wanted to get the exact number at all times. Not needed values over time just wanted to get the exact value in real-time.
Considering that I have Grafana running for a number of reasons, I did want to get that data presented inside it in any way possible.
To Infinity, and beyond!
Docker API can return values if you query it with your repository and image name by using the following link:
https://hub.docker.com/v2/repositories/<nameofrepository>/<nameofimage>
NameOfRepository - enter the name of your image repository
NameOfImage - enter the name of your image
There are two parameters that you need to change in order to get exact values. So what do you get as an output while hitting this web URL. It's something like this:
{"user": "blackvoidclub", "name": "midnight-commander", "namespace": "blackvoidclub", "repository_type": "image", "status": 1, "description": "Midnight Commander CLI app v4.8.25", "is_private": false, "is_automated": false, "can_edit": true, "star_count": 2, "pull_count": 53528, "last_updated": "2021-08-17T15:48:55.376939Z", "is_migrated": false, "collaborator_count": 0, "affiliation": "owner", "hub_user": "rusty1281", "has_starred": false, "full_description": ......}
As you can see, there are all the values that you see on the Docker image page, including stars, and pull counter. These are the values I was interested in.
As the result of this URL is a JSON output, I needed something that can parse this data and then present it in Grafana. Luckily, there is a plugin that you can load up into Grafana and connect it to the JSON URL, brilliant.
Let's see how easy it is to set it up.
STEP 01 - Setup Grafana
I will not explain how to set up Grafana here as that is already part of this article under the "Grafana Docker container" heading.
Once you configure it, continue forward.
STEP 02 - Install Infinity plugin
To make this work, you will need to have the Infinity plugin accessible as a data source inside your Grafana platform.

To install it, open a bash command-line into your Grafana container and run the following command:
grafana-cli plugins install yesoreyeram-infinity-datasource
Once the command is executed, restart the Grafana container!
STEP 03 - Activate Infinity plugin in Grafana
Once you log into your Grafana interface, go to the Add data source section using the left-hand menu.
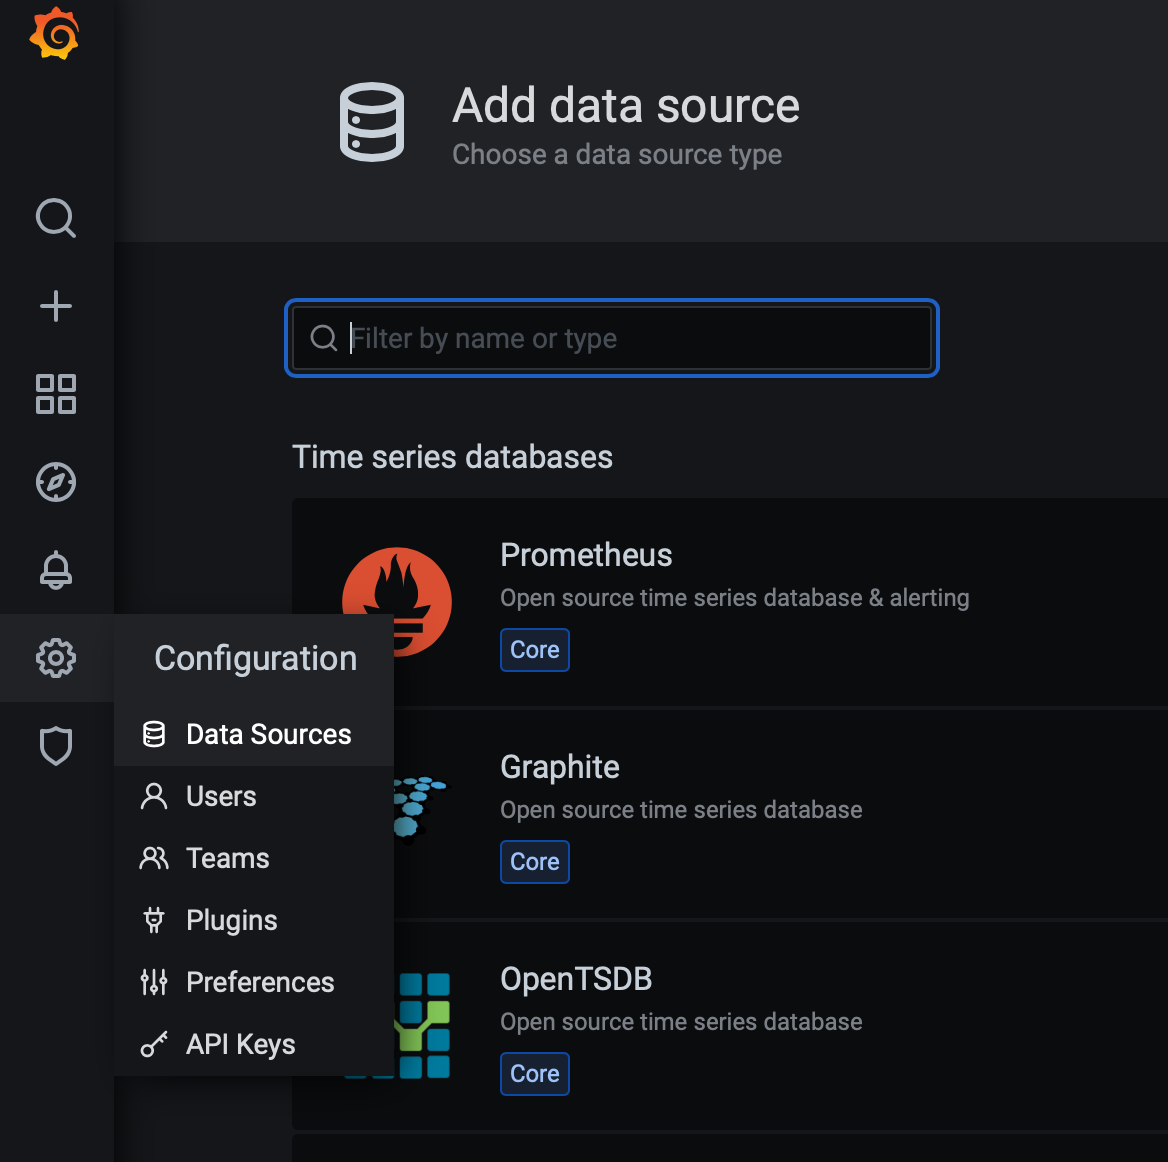
In the list, you should find the Infinity plugin on the bottom of the list under Others section
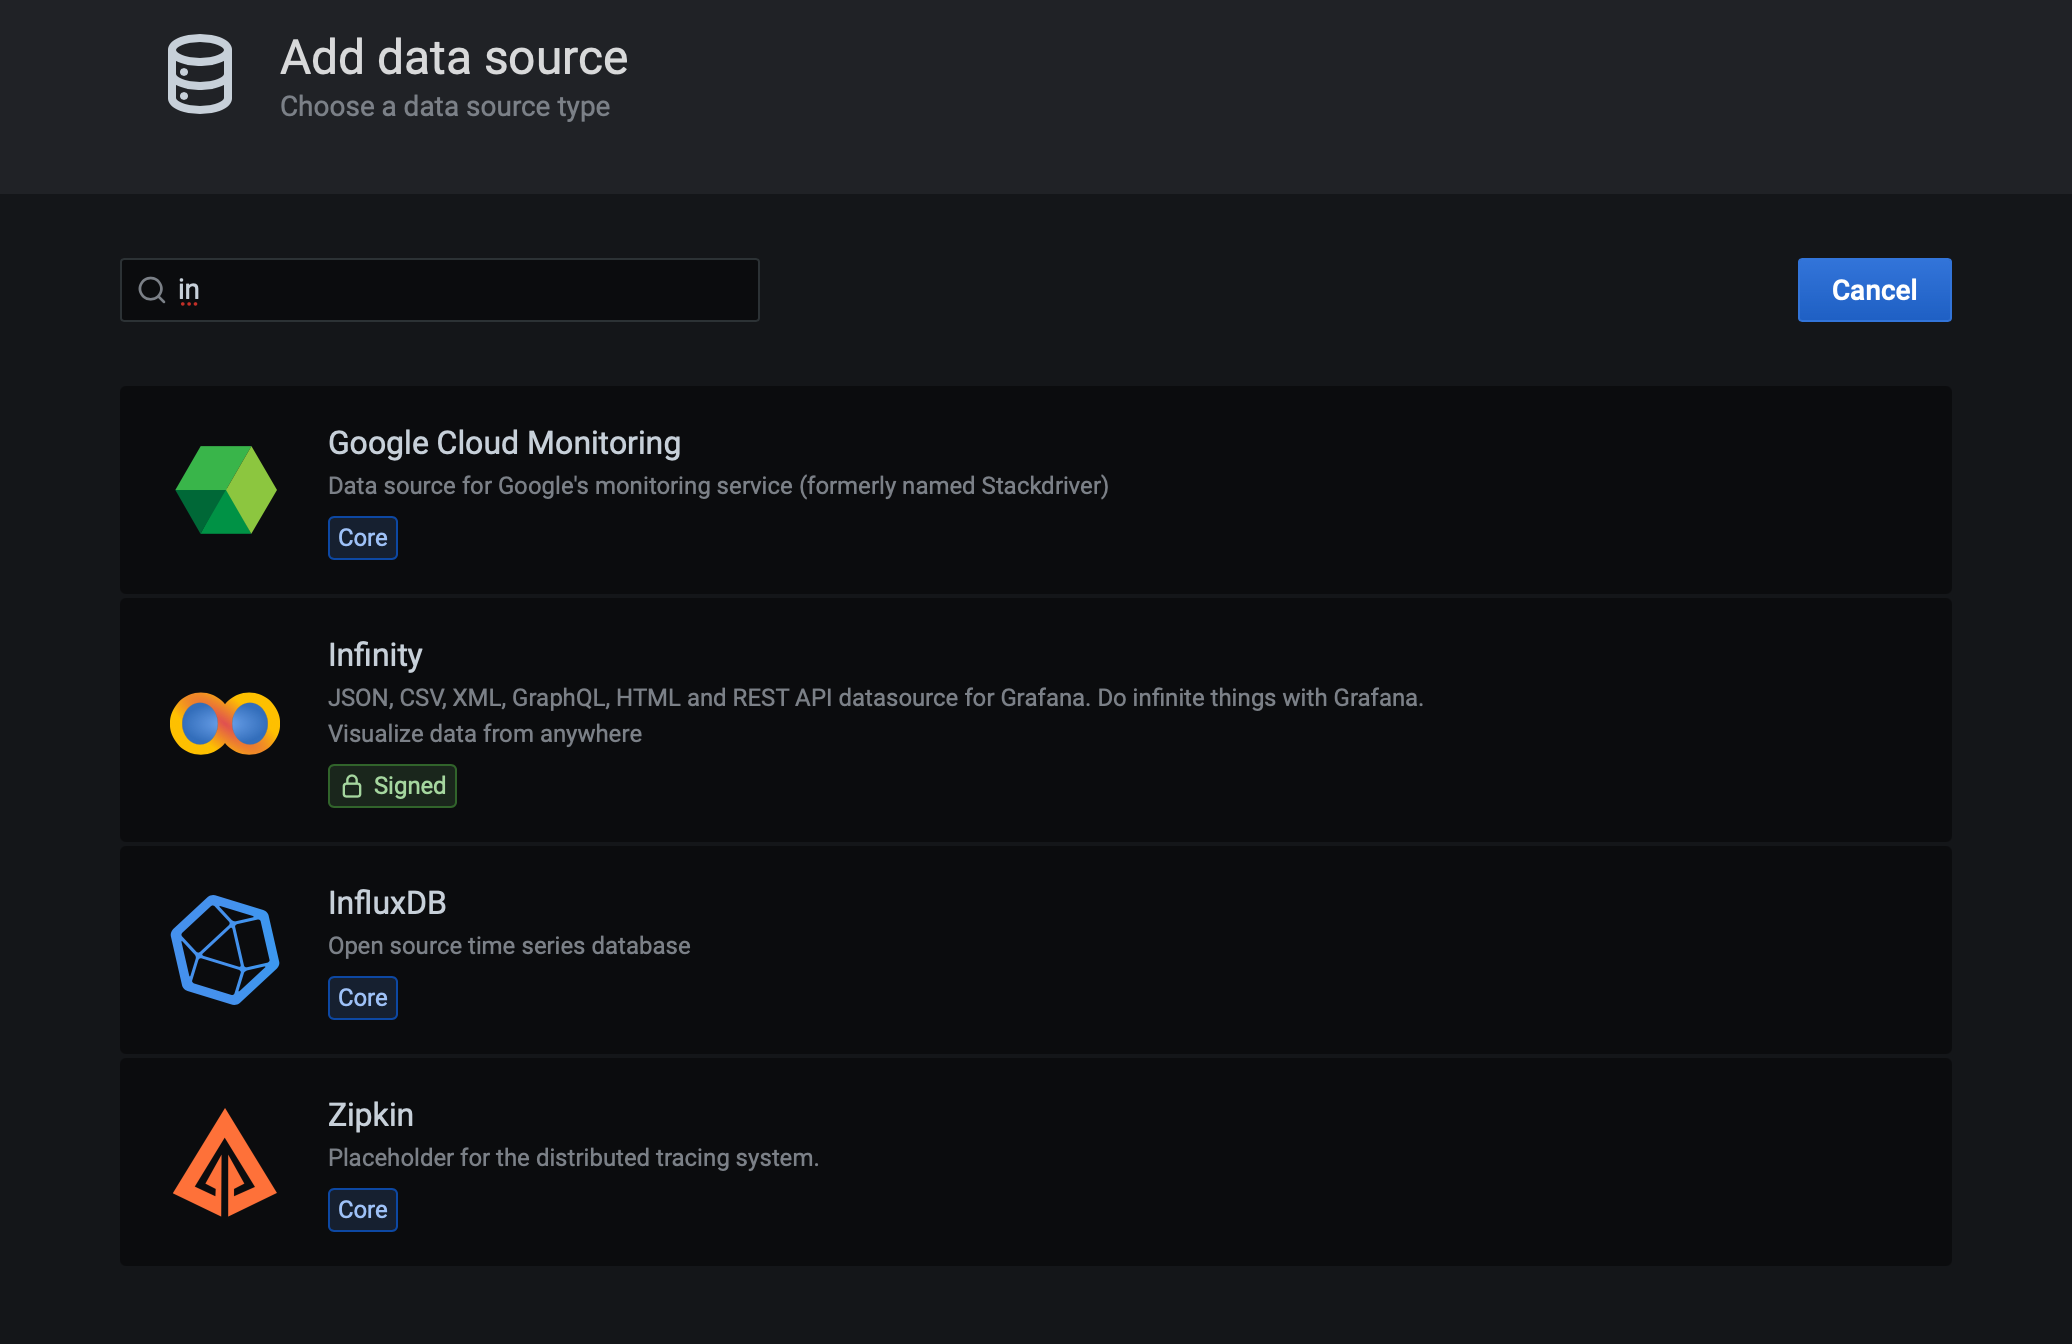
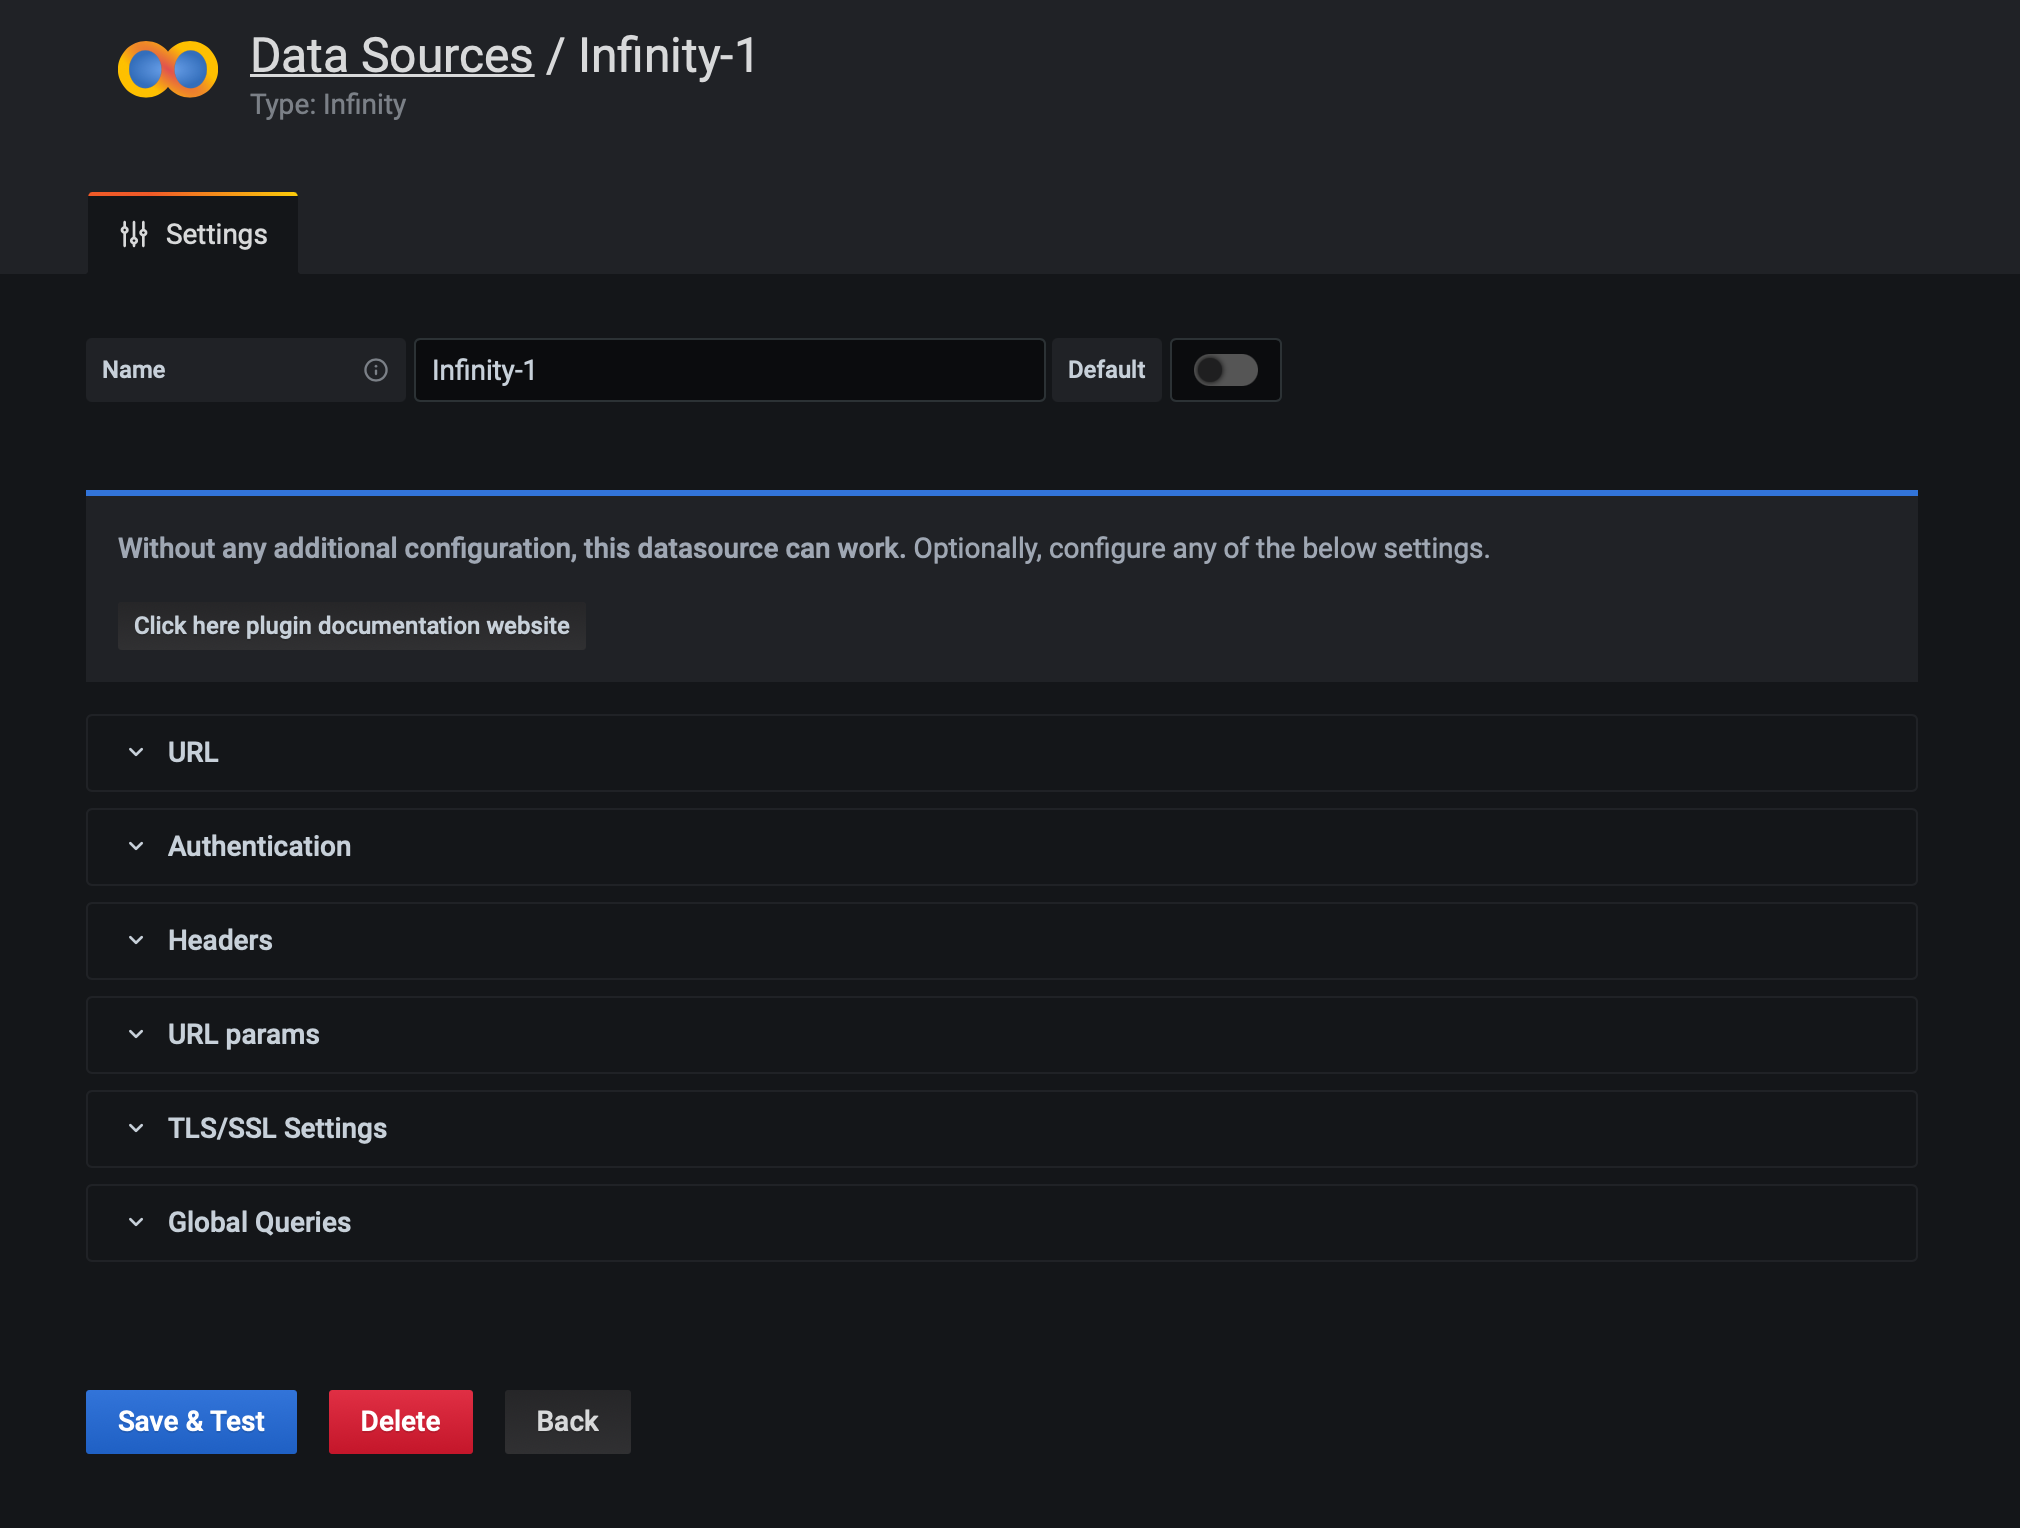
Select the Infinity plugin, give it a name, and click the blue Save & Test button.
Now that we have connected Grafana with the Infinity plugin it is time to pull in the JSON file using the Docker Hub URL and see what the initial result will be.
STEP 04 - Parse Docker HUB stats using Infinity plugin
In Grafana, start a new dashboard (or existing one), add a new panel, and configure it with Infinity.
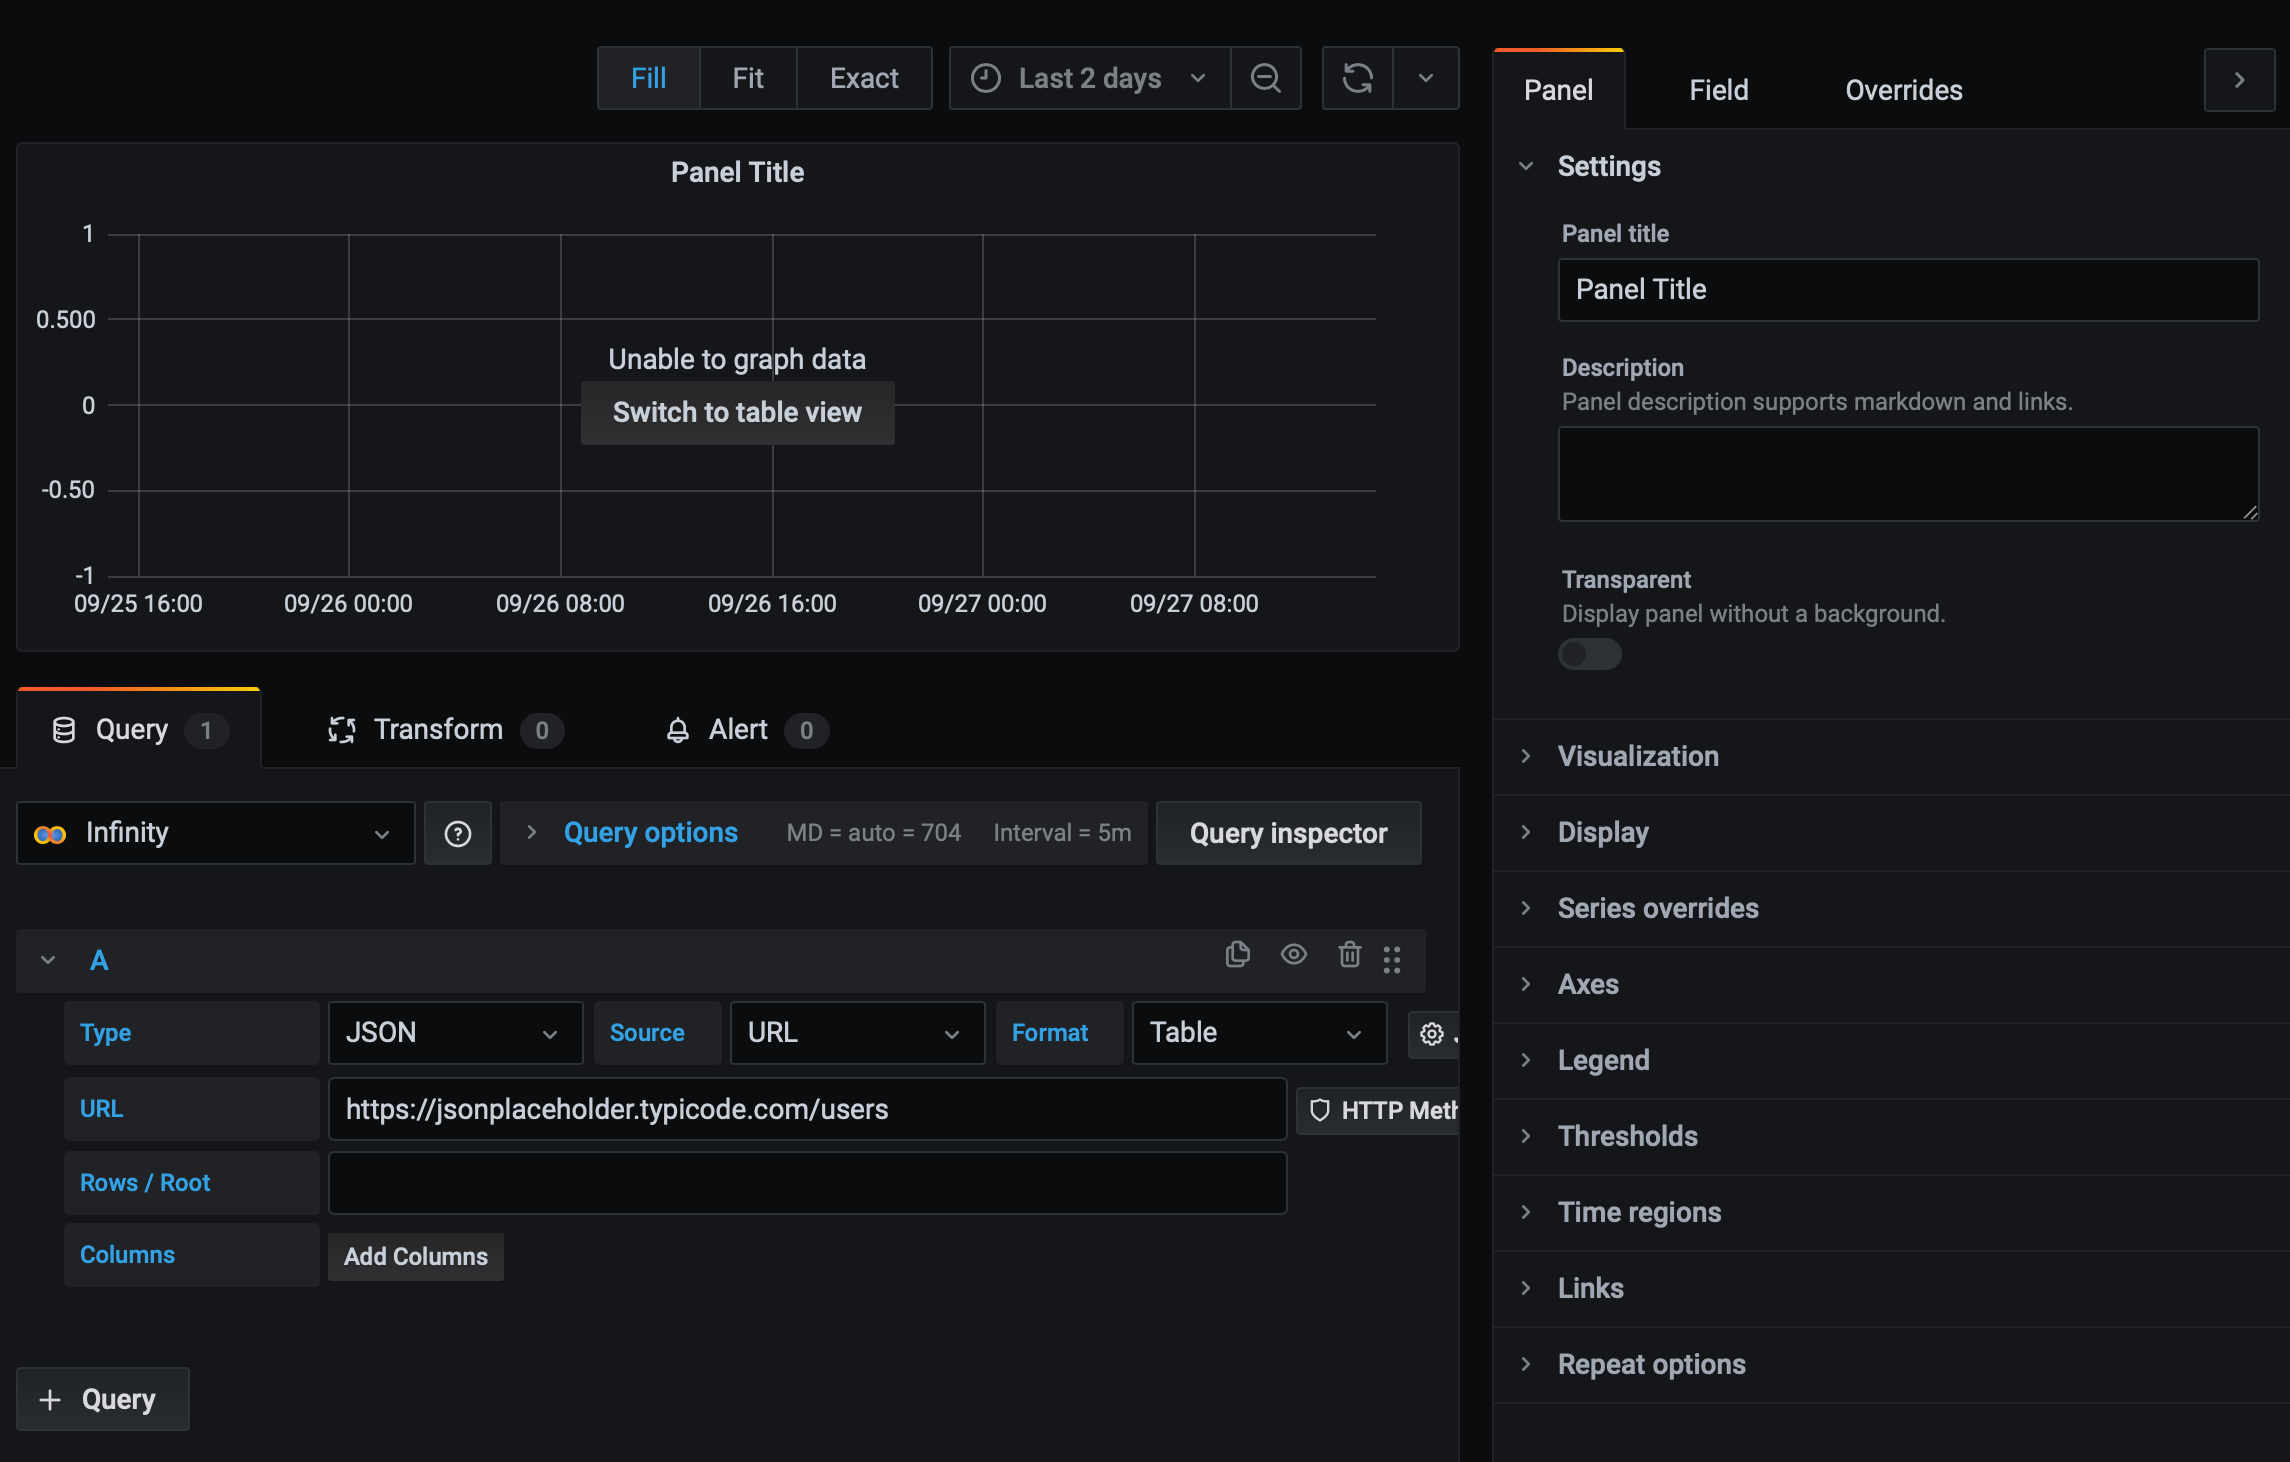
The main thing to do here is to use the query data source dropdown menu and select Infinity as the source. This will load up tools and elements needed to parse data from Docker HUB URL.
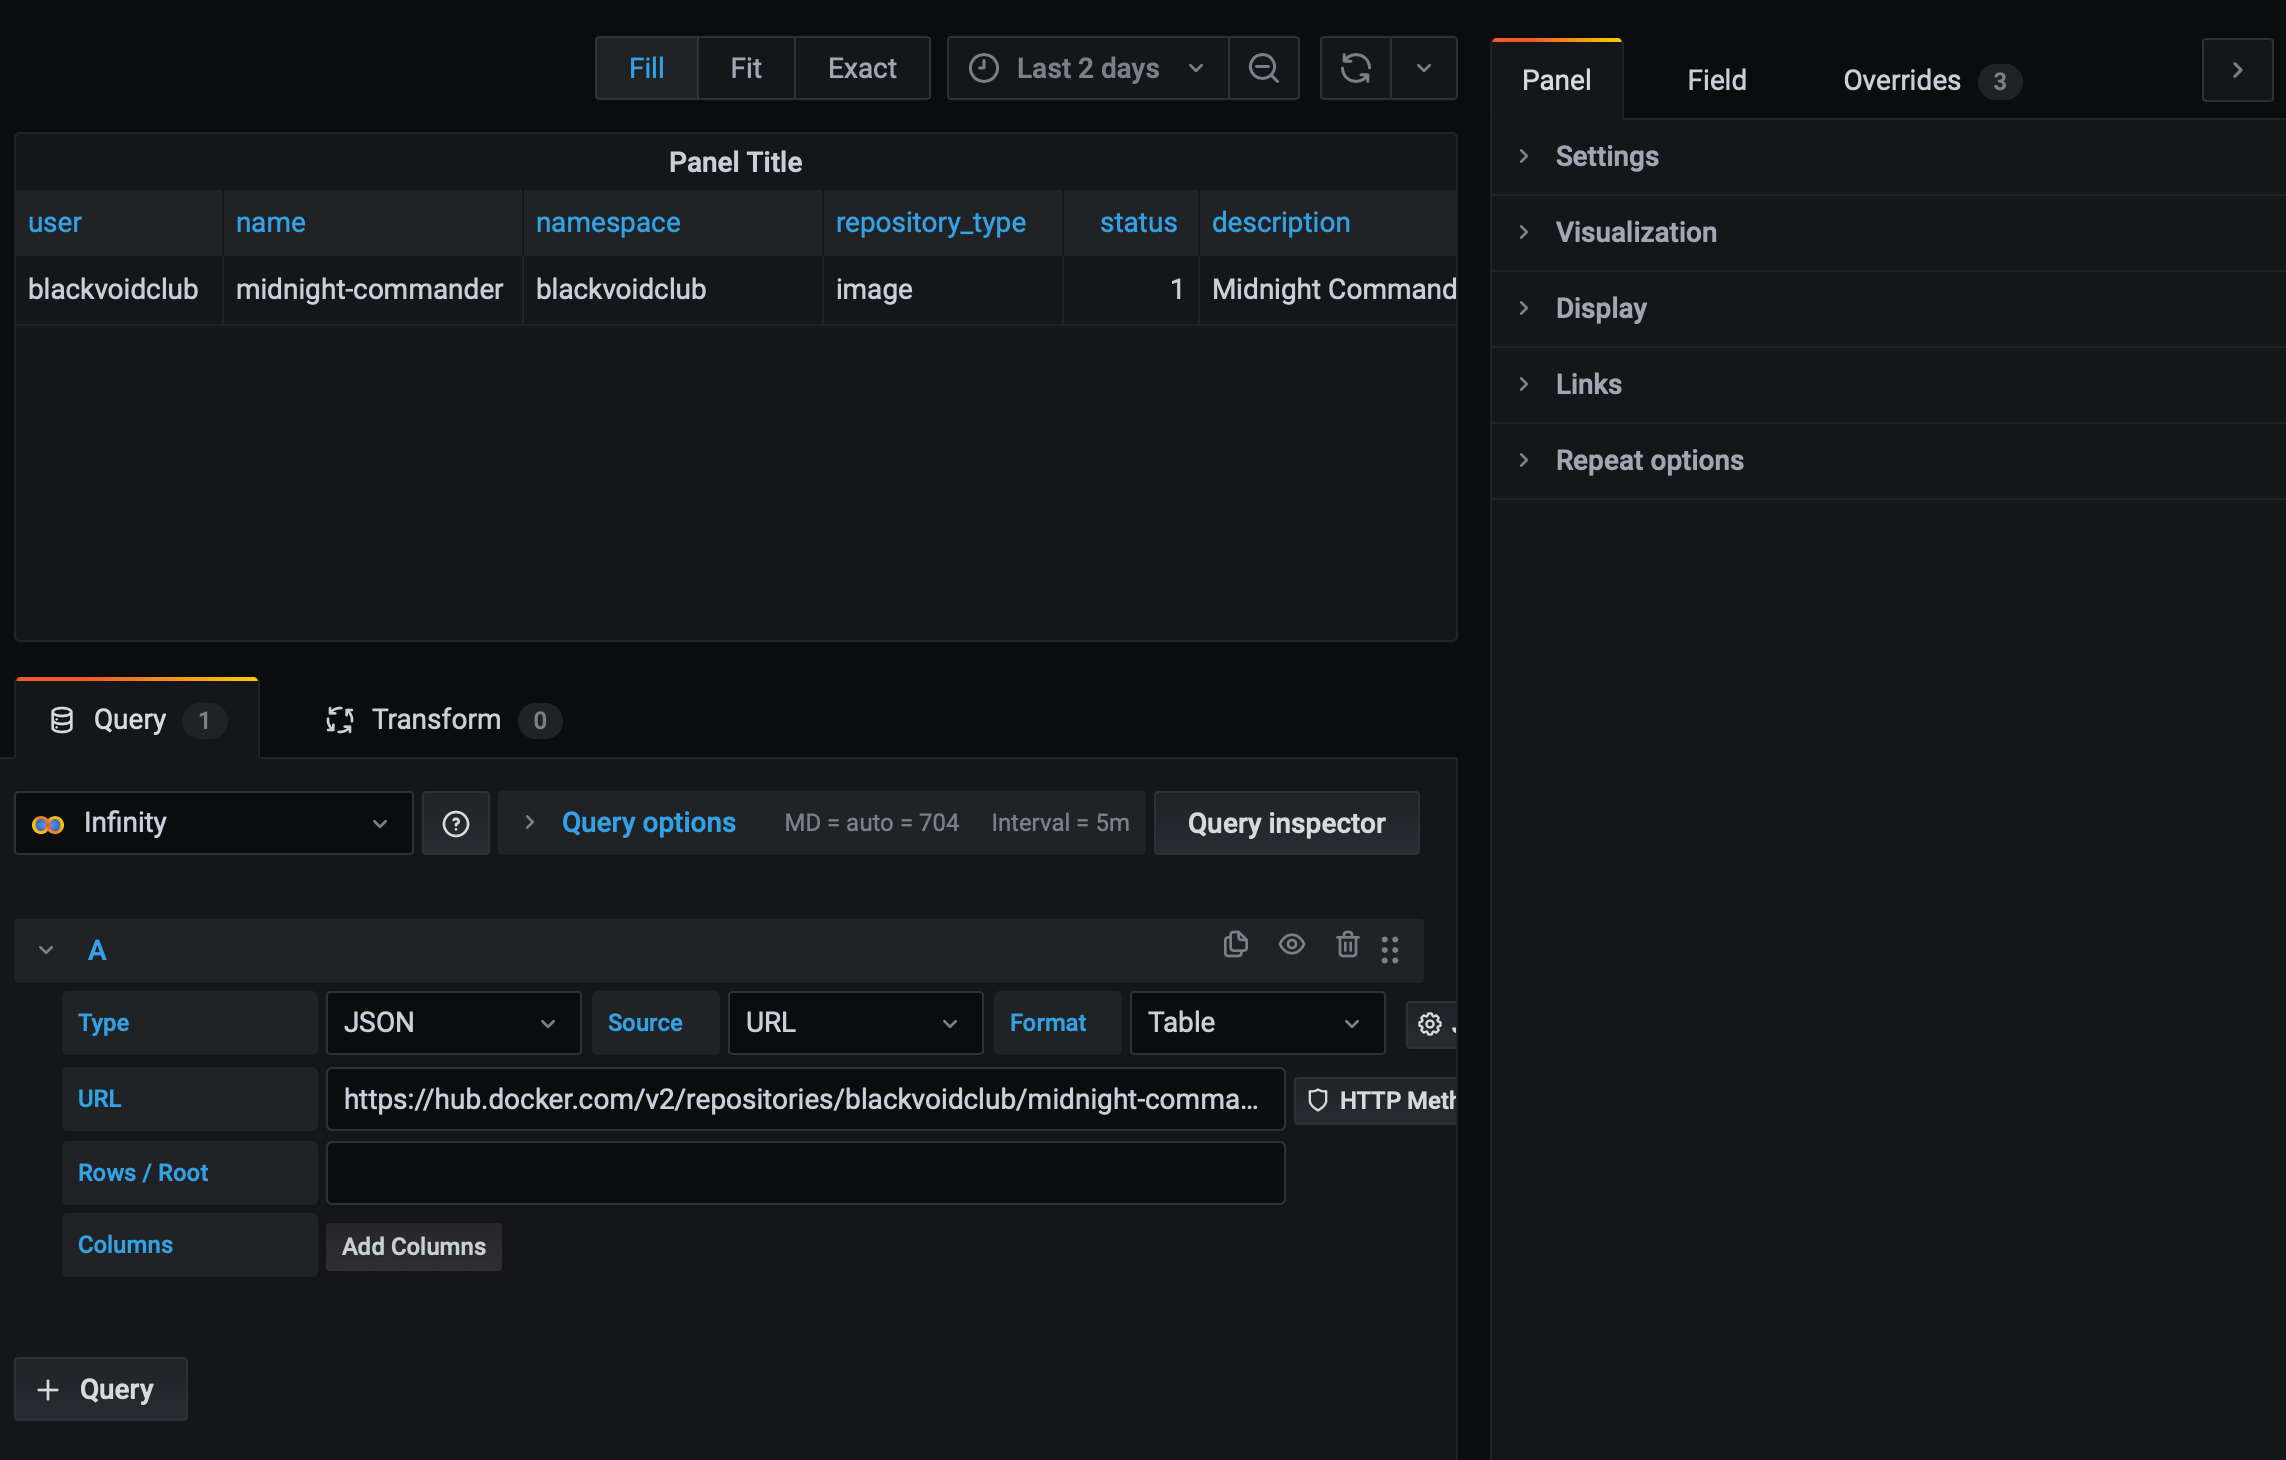
Well, that was simple enough. The only thing left now is to use Grafana features to pull only data that you need and customize it the way you want to.
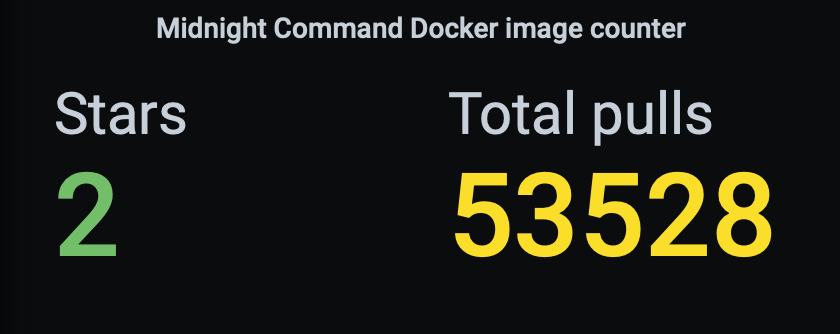
This panel is using the Grafana Stat visualization with certain color customization.
Hope this might come in handy for anyone looking to pull in data from any other public API, other than this particular example, and present it in Grafana.