Grafana 8 - InfluxDB 2 - Telegraf - 2021 monitoring stack


Table of Contents
InfluxDB 2 Docker container
Configuring Telegraf token in InfluxDB instance
Configuring and connecting Telegraf to InfluxDB
Telegraf Docker container
Grafana Docker container
Connecting Grafana to InfluxDB
Examples
About two years ago I wrote the same article like this one. How to run your GIT monitoring stack with Grafana, InfluxDB, and Telegraf.
Like with every platform, both Grafana and InfluxDB have been updated to give us more features, more options, and to follow users' needs and demands. The reason for this article is to stay up to date with the new features as well as see if there are some other benefits of running the new platforms.
The same principle as before remains. You need three major components to make this run in your Docker setup:
01. InfluxDB 2 - database element for your metrics
02. Telegraf - agent that will ship the metrics to Influx
03. Grafana - the web UI that will present the metrics
You might notice that I have placed Grafana last on the list. The reason is that we first have to configure our DB then the agent(s), and finally Grafana that will present it all.
Compared to the previous article, there will be some changes that will be specific to using the latest (current) versions of Influx and Grafana, and I will point out what those are. Also, be prepared to use a different query language to present the data in Grafana than before as InfluxDB 2 uses the new Flux language, and not InfluxQL as before.
Let's begin! I will keep each container separate, and not run them as a single docker-compose stack, but you can if you choose to do so.
InfluxDB 2 Docker container
So to start with InfluxDB, you can use the latest Docker image or any image that is 2.0 or above.
Use the following docker-compose to run the new InfluxDB 2:
version: "3.5"

services:
  influxdb2:
    image: influxdb:latest
    network_mode: "bridge"
    container_name: influxdb2
    ports:
      - "8086:8086"
    volumes:
      - type: bind
        source: /volume1/docker/influxdb2/data
        target: /var/lib/influxdb2
      - type: bind
        source: /volume1/docker/influxdb2/config
        target: /etc/influxdb2
    environment:
      - DOCKER_INFLUXDB_INIT_MODE=setup
      - DOCKER_INFLUXDB_INIT_USERNAME=yourInfluxAccount
      - DOCKER_INFLUXDB_INIT_PASSWORD=yourInfluxPassword
      - DOCKER_INFLUXDB_INIT_ORG=chooseOrgName
      - DOCKER_INFLUXDB_INIT_BUCKET=chooseBucketName
      - DOCKER_INFLUXDB_INIT_RETENTION=1w
      - DOCKER_INFLUXDB_INIT_ADMIN_TOKEN=randomTokenValue
    restart: always
Ok, a bit of context here regarding some of the variables (we will get back to them later on as well).
Starting with InfluxDB2, you will need to use a username, password, as well as organization value, bucket, and token.
So the bucket is the "database" container that will hold the data, and to get to it and read/write data to it you will need a valid token (more on this soon).
The main thing to remember here is that I suggest you start with a token value because if you will not set it, Influx will configure it for you. That's ok, we will have to make one more token later on anyways, but just keep in mind that token is a thing now.
Depending on how much data you will be pushing into Influx and how often, I would advise setting the retention period as well. In this example, I have configured it to 1 week just because I do not need to keep any data longer than that.
Now open up Portainer, (or use the docker-compose command line to execute the creation of the container) head to stacks and configure your InfluxDB stack there, and you are done for now.
Once your container is up, open your browser and log into your Influx instance using the username and password values you have set in the docker-compose file.
Use this URL: http://yourNASIP:8086 or any other port in case you have changed it. If all is well you should get this:
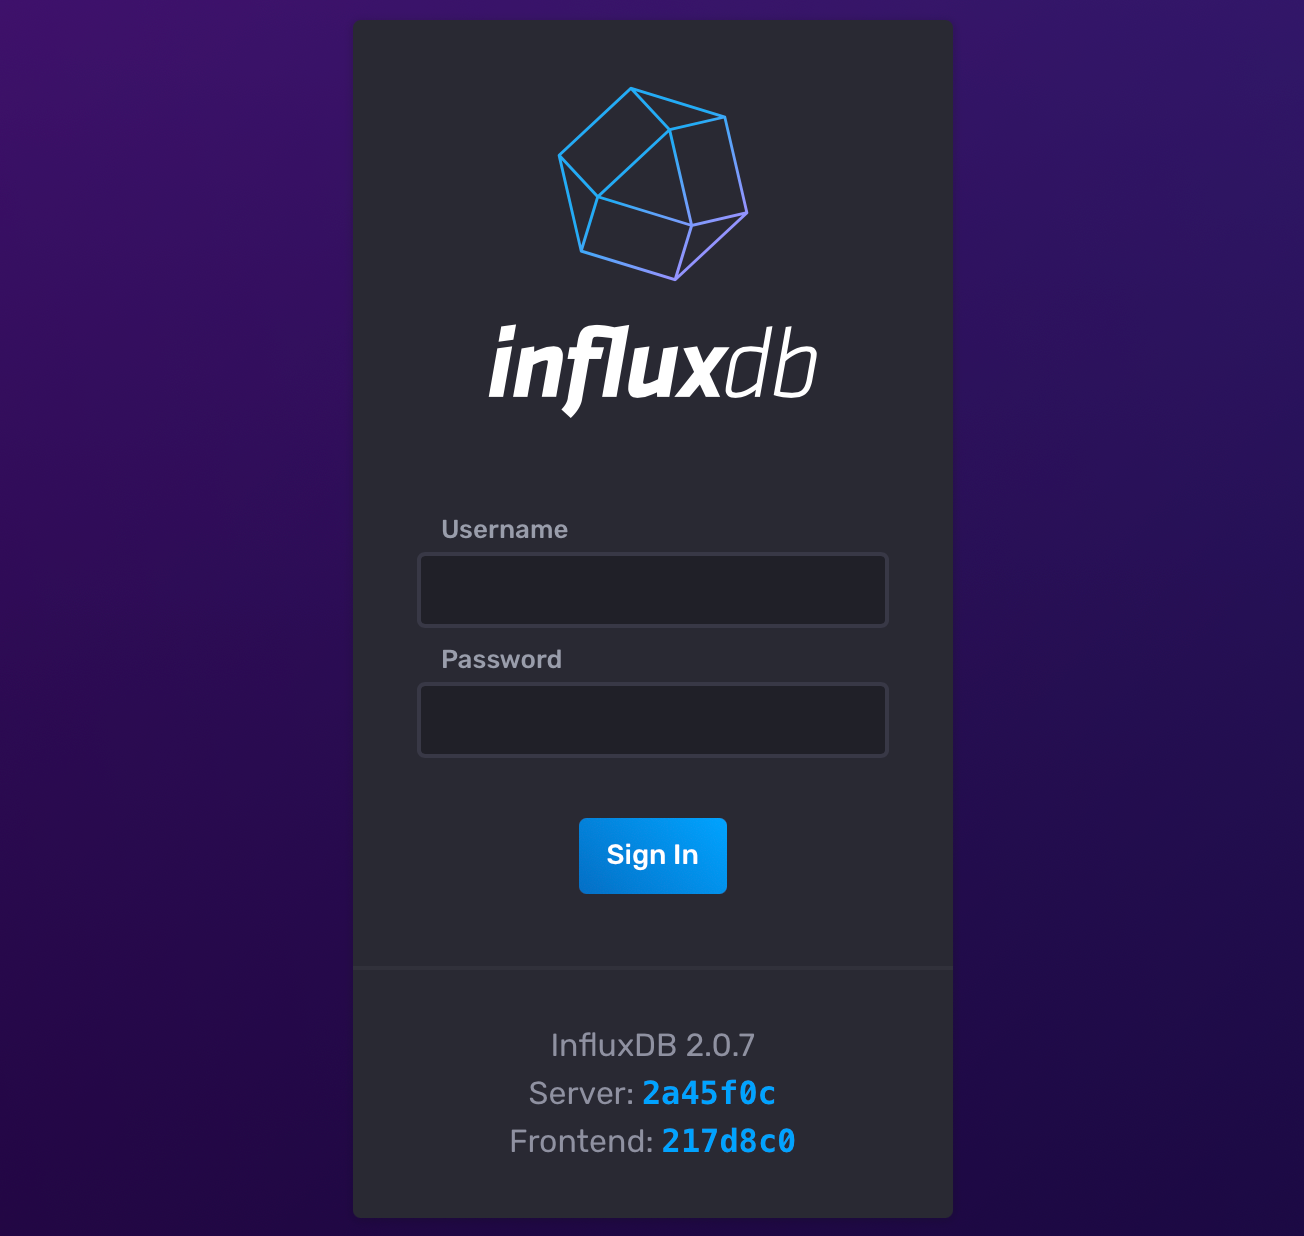
For now, that's it. Now let's check Influx, and configure the token needed in the next step, configuring Telegraf.
Configuring Telegraf token in InfluxDB instance
After you log into your Influx instance there is one thing that we need before we continue forward with this whole setup, creating a token for the Telegraf.
Head over to Data > Token (tab) > Generate token (button)
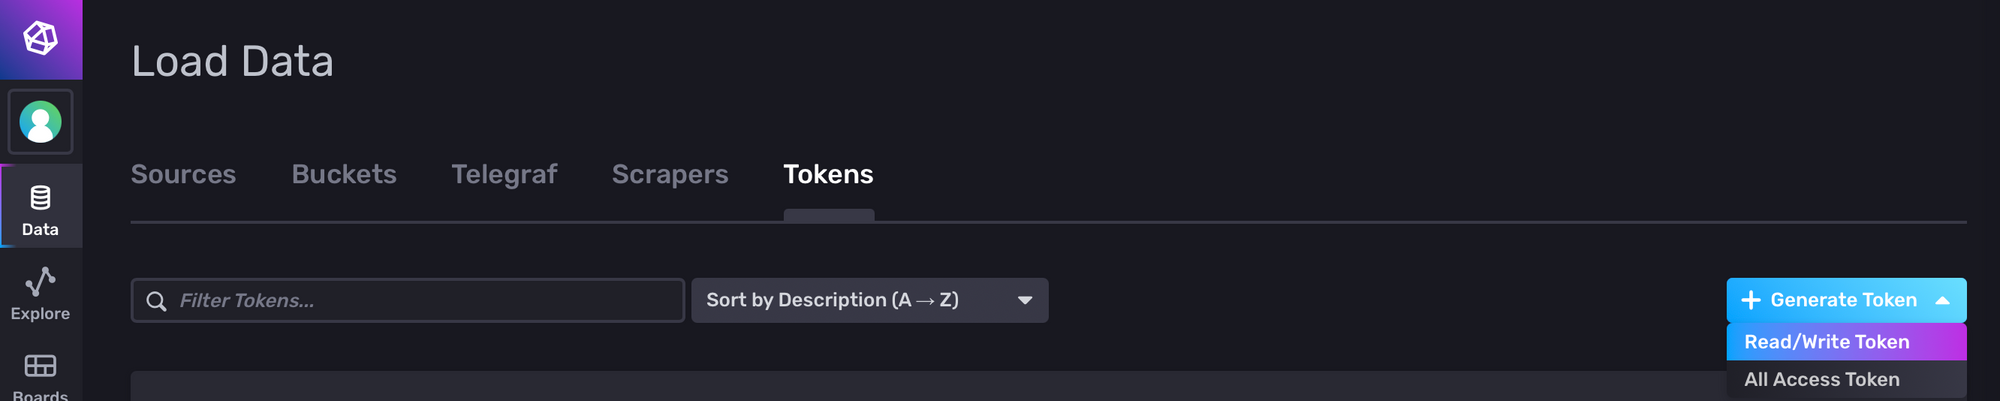
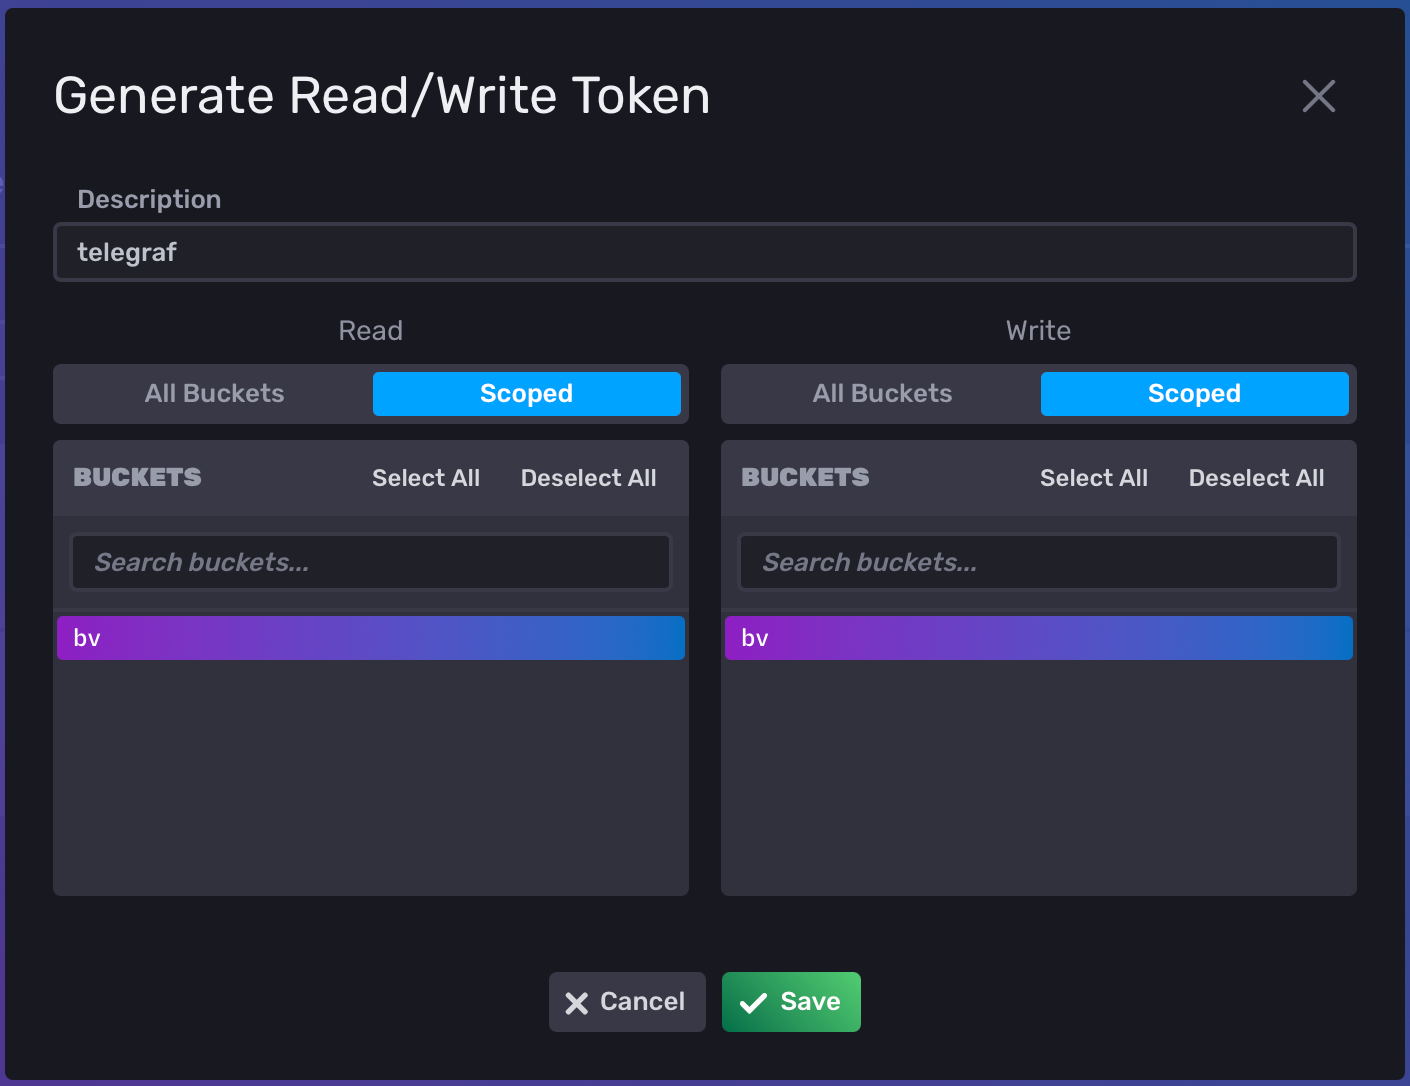
In the new window, enter the name value of telegraf and select your bucket name for both the read and write a column. Finally, click Save.
Once your token has been generated, click on its name to reveal the token value. Have it at hand as we will need it in the next step.
That's it, we are now ready to start configuring the Telegraf configuration file.
Configuring and connecting Telegraf to InfluxDB
Considering that the agent is one of the most important elements here, it will be needed to configure it first, before we spring up the container.
So make sure that you have the image downloaded before doing this step. To download the image, go to your NAS via SSH and elevate to root with sudo -i then run docker pull telegraf:latest .
After the image has been downloaded run the following command to generate the default creation of the telegraf.conf file:
docker run --rm telegraf:latest telegraf config > /volume1/docker/telegraf/telegraf.conf
You can change the target destination to match your own, just make sure that the location where the file needs to be created already exists before running the command.
This will generate a long (over 8000 lines) config file that needs to be configured. There are not nearly as many parameters that need to be configured as 99% of the file is commented out.
So depending on your needs, you will "enable" the elements that you want and need, and that will be it. Here is the example of parameters needed to connect to influxdb2, monitor your NAS CPU, RAM, HDD, and network, as well as monitor your Docker stack.
 ## Override default hostname, if empty use os.Hostname()
  hostname = "ENTER_YOUR_NAS_HOST_NAME"
  ## If set to true, do no set the "host" tag in the telegraf agent.
  omit_hostname = false
###############################################################################
#                            OUTPUT PLUGINS                                   #
###############################################################################
# # Configuration for sending metrics to InfluxDB
 [[outputs.influxdb_v2]]
#   ## The URLs of the InfluxDB cluster nodes.
#   ##
#   ## Multiple URLs can be specified for a single cluster, only ONE of the
#   ## urls will be written to each interval.
#   ##   ex: urls = ["https://us-west-2-1.aws.cloud2.influxdata.com"]
   urls = ["http://YOUR_NAS_IP:8086"]
#
#   ## Token for authentication.
   token = "ENTER_YOUR_TELEGRAF_TOKEN_VALUE"
#
#   ## Organization is the name of the organization you wish to write to; must exist.
   organization = "YOU_ORGANIZATION_VALUE_FROM_INFLUX"
#
#   ## Destination bucket to write into.
   bucket = "YOU_BUCKET_VALUE_FROM_INFLUX"
###############################################################################
#                            INPUT PLUGINS                                    #
###############################################################################


# Read metrics about cpu usage
[[inputs.cpu]]
  ## Whether to report per-cpu stats or not
  percpu = true
  ## Whether to report total system cpu stats or not
  totalcpu = true
  ## If true, collect raw CPU time metrics
  collect_cpu_time = false
  ## If true, compute and report the sum of all non-idle CPU states
  report_active = false


# Read metrics about disk usage by mount point
[[inputs.disk]]
  ## By default stats will be gathered for all mount points.
  ## Set mount_points will restrict the stats to only the specified mount points.
  # mount_points = ["/"]

  ## Ignore mount points by filesystem type.
  ignore_fs = ["tmpfs", "devtmpfs", "devfs", "iso9660", "overlay", "aufs", "squashfs"]
# Read metrics about disk IO by device
[[inputs.diskio]]
# Get kernel statistics from /proc/stat
[[inputs.kernel]]
  # no configuration
# Read metrics about memory usage
[[inputs.mem]]
  # no configuration
# Get the number of processes and group them by status
[[inputs.processes]]
  # no configuration
# Read metrics about swap memory usage
[[inputs.swap]]
  # no configuration
# Read metrics about system load & uptime
[[inputs.system]]
  ## Uncomment to remove deprecated metrics.
  # fielddrop = ["uptime_format"]
# # Read metrics about docker containers
 [[inputs.docker]]
#   ## Docker Endpoint
#   ##   To use TCP, set endpoint = "tcp://[ip]:[port]"
#   ##   To use environment variables (ie, docker-machine), set endpoint = "ENV"
#   endpoint = "unix:///var/run/docker.sock"
#
#   ## Set to true to collect Swarm metrics(desired_replicas, running_replicas)
#   gather_services = false
#
#   ## Only collect metrics for these containers, collect all if empty
   container_names = []
#
#   ## Set the source tag for the metrics to the container ID hostname, eg first 12 chars
#   source_tag = false
#
#   ## Containers to include and exclude. Globs accepted.
#   ## Note that an empty array for both will include all containers
   container_name_include = []
   docker_label_include = []
The main element here is values in the OUTPUT PLUGINS section.
Alter the values as you choose fit, and configure them so they match your Influx settings. This is the place where you will use your telegraf token value that you have configured in the previous step.
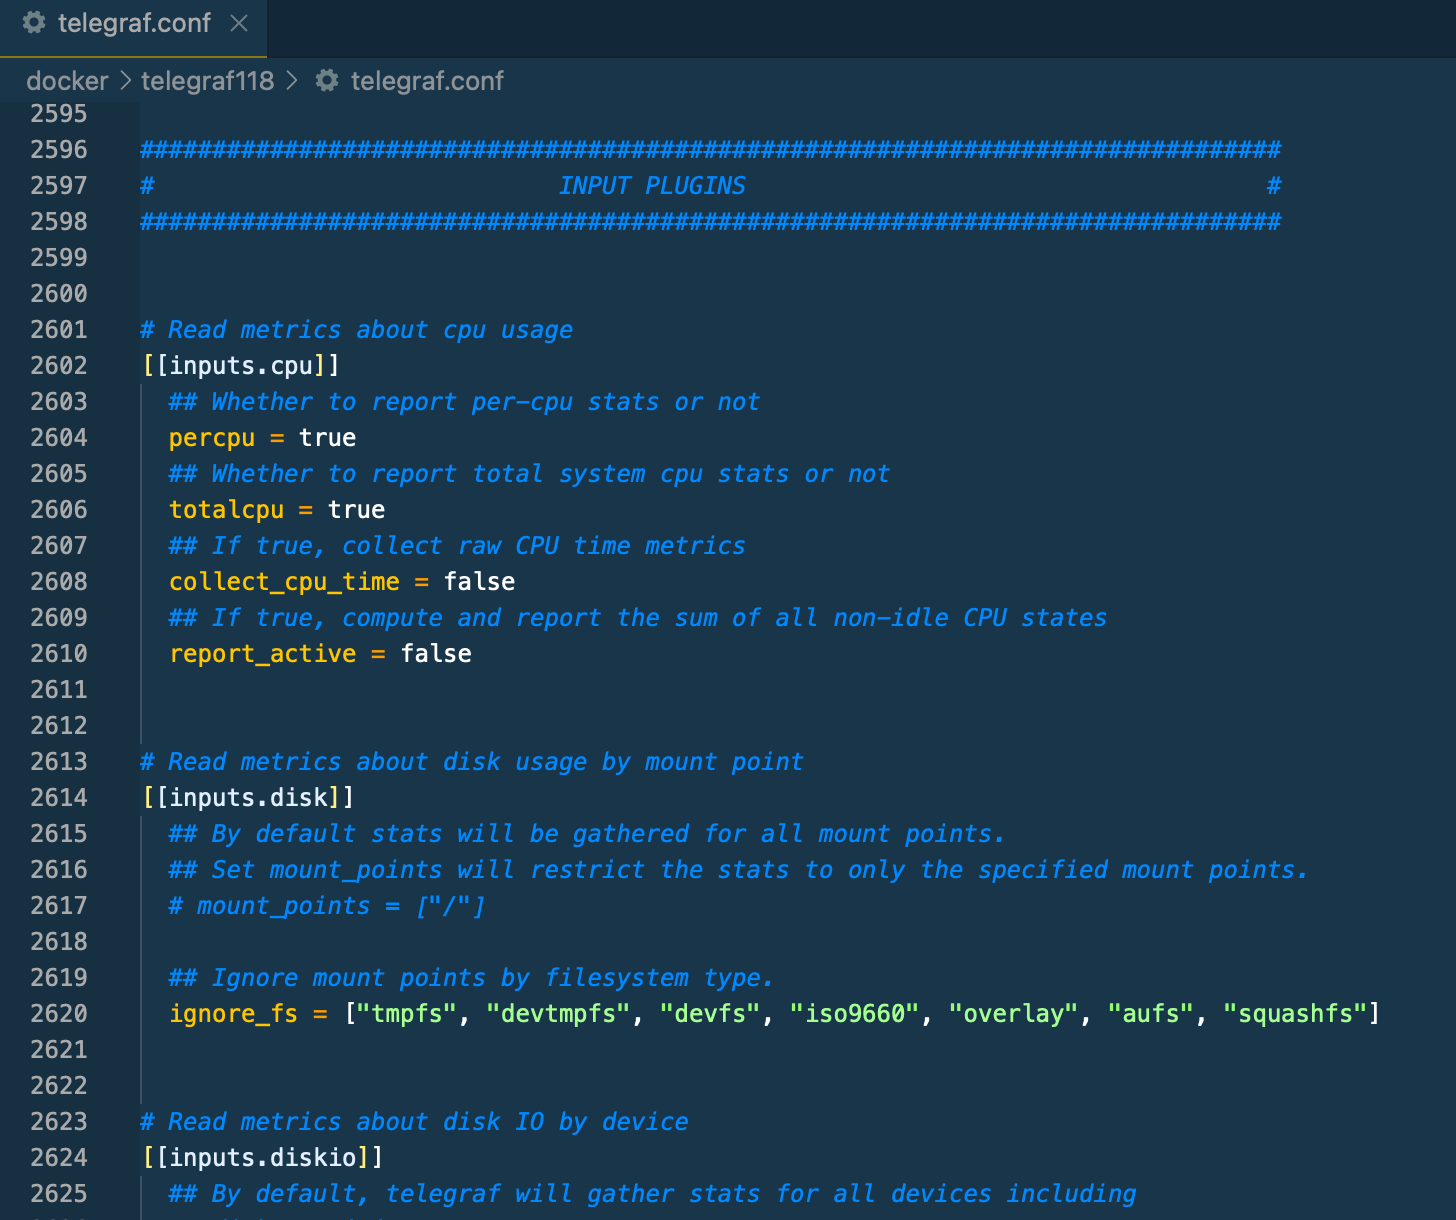
This image above is just an example of how using a proper tool for editing a CONF file looks like as appose to a generic "notepad" like app.
Now that the config file is configured it is time to bring up the Telegraf container online.
Telegraf Docker container
Use the following docker-compose to run the Telefgraf container:
version: "3.5"

services:
  telegraf:
    image: telegraf:latest
    network_mode: "bridge"
    pid: "host"
    container_name: telegraf
    ports:
      - "8092:8092"
      - "8094:8094"
      - "8125:8125"
    volumes:
      - /volume2/docker/telegraf/telegraf.conf:/etc/telegraf/telegraf.conf:ro
      - /var/run/docker.sock:/var/run/docker.sock:ro
      - /sys:/host/sys:ro
      - /proc:/host/proc:ro
      - /etc:/host/etc:ro
    environment:
      - HOST_PROC=/host/proc
      - HOST_SYS=/host/sys
      - HOST_ETC=/host/etc
    restart: always
Notice that there are Docker volume and variable mappings that will allow us to pull data regarding Docker containers as well.
Make sure to bind the telegraf.conf file that you have configured, and start the container.
Check if Telegraf metrics are coming into your InfluxDB
Now that Telegraf is up and running it is time to check if the metrics are coming in. Best and easy way to do this is to check the Influx bucket. So open up your Influx WebUI, log in, and open the bucket:
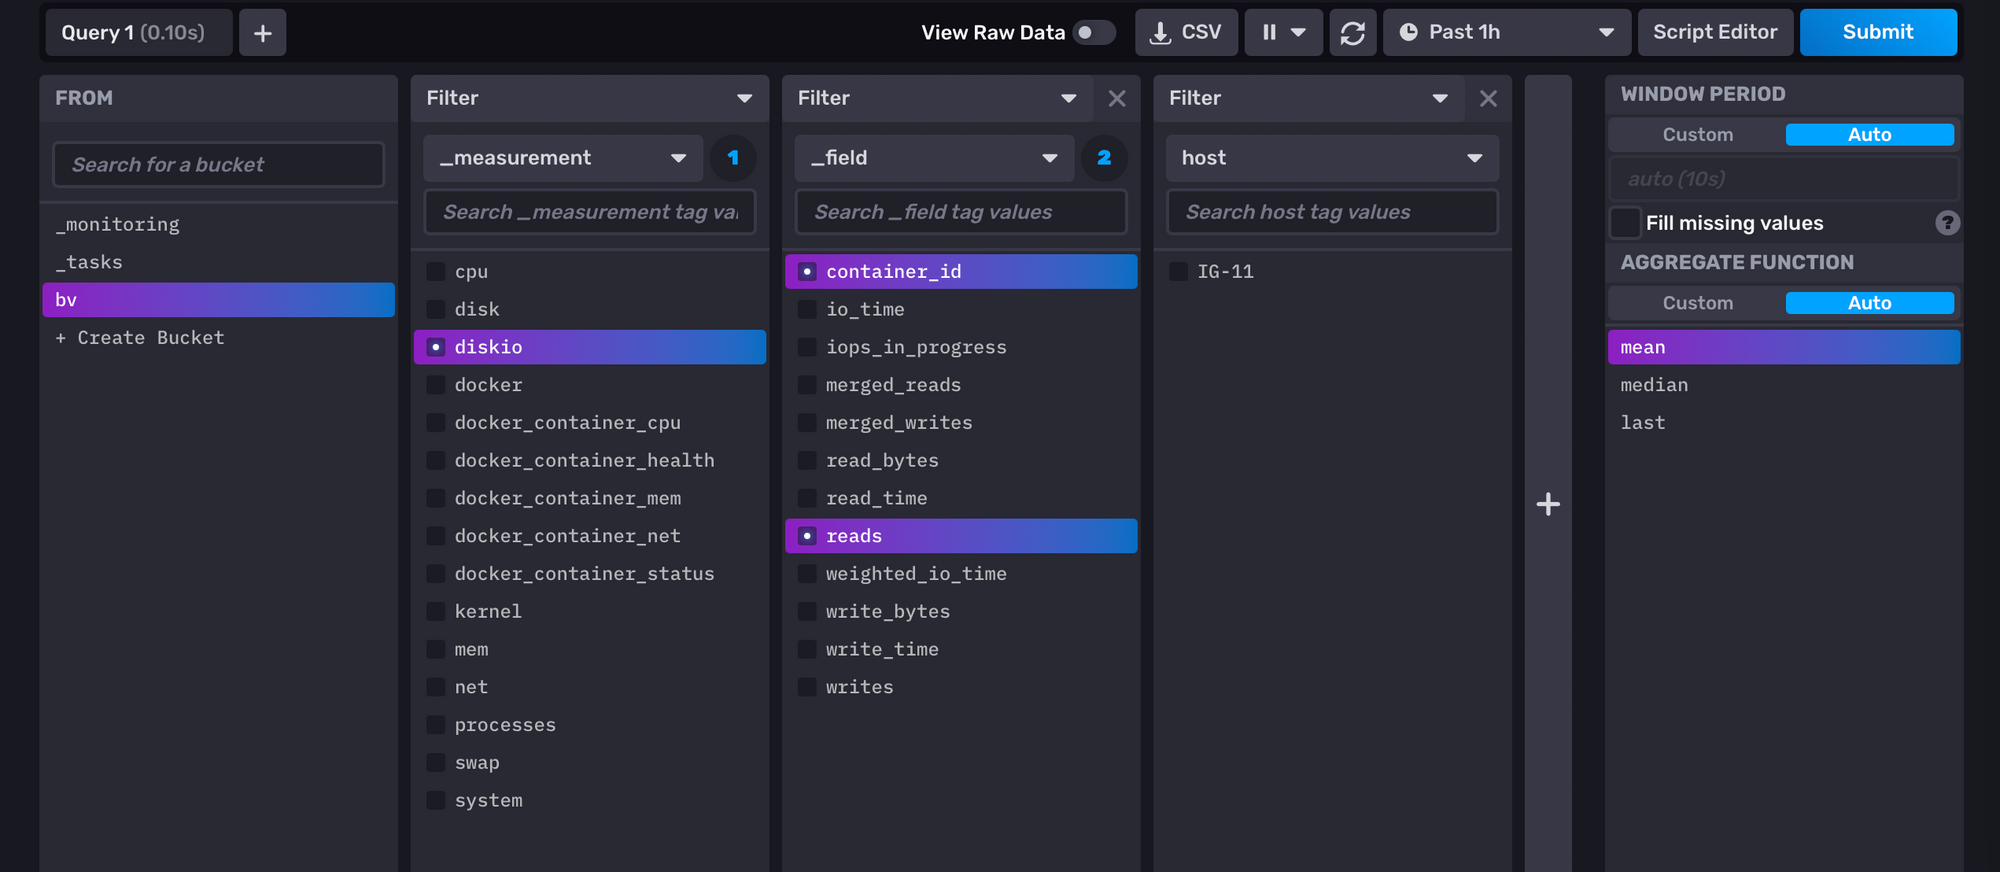
Inside Influx jump, to the Explore tab, and at the bottom, you should see a list of your buckets on the far left-hand side. Clicking it you will continue to "build" on more columns when selecting specific measurements, fields, and values. Once you are done, click the blue submit button, and your content should appear at the top.
Also visible on this screen is the Script Editor button. Click it and you will get the Flux language query, that you can then use in Grafana.
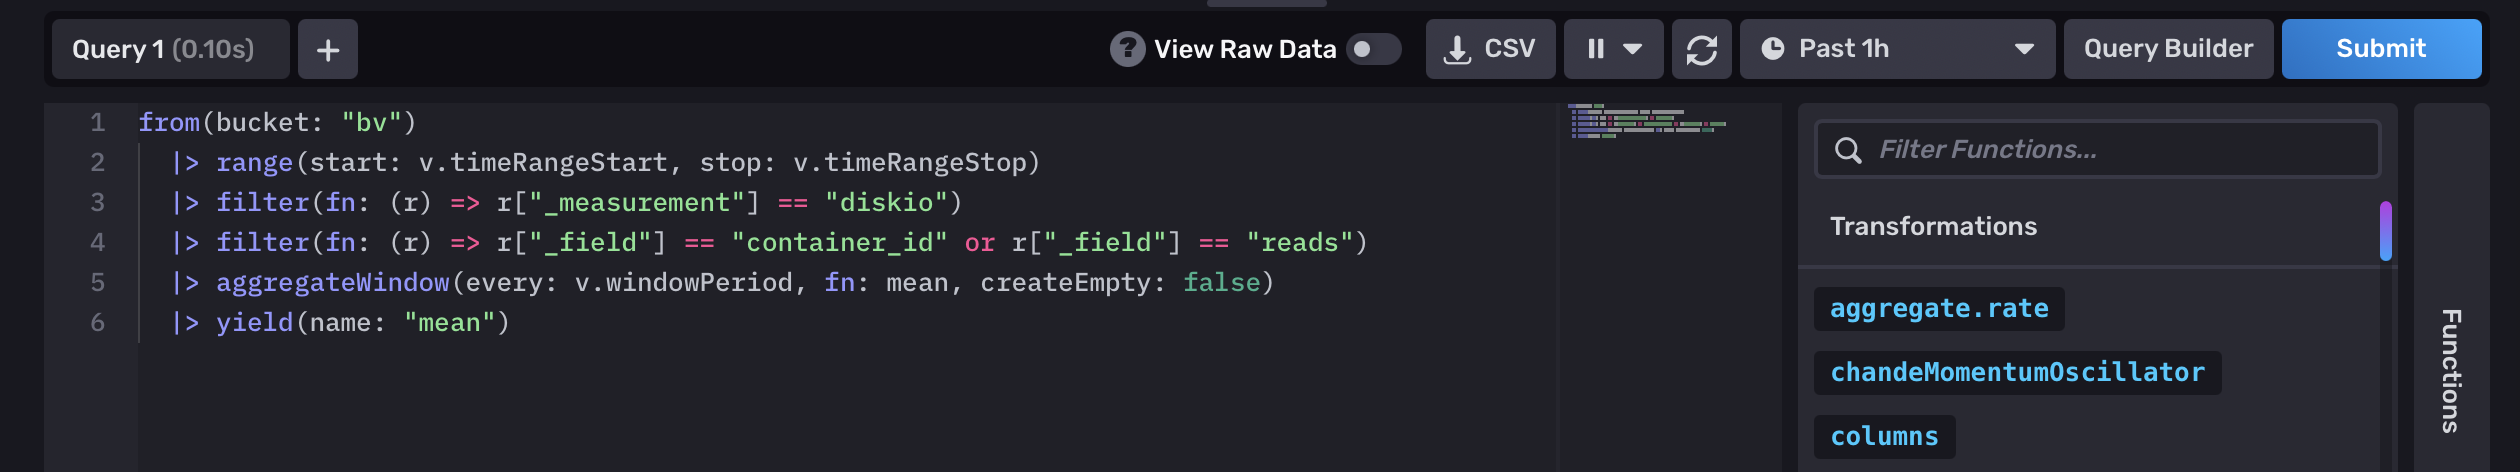
Grafana Docker container
Finally, one more container to start up. Grafana is a simple and easy container, so just make a new stack and use the following docker-compose:
version: "3.5"

services:
  grafana8:
    image: grafana/grafana:latest
    network_mode: "bridge"
    container_name: grafana8
    volumes:
      - /yourGrafanafolder:/var/lib/grafana
    ports:
      - "3000:3000"
    restart: always
Change the port if you want but remember to use that port to log into the UI. To get to Grafana simply point your browser to the following URL: http://yourNASIP:3000 , and you will be greeted with the login screen.
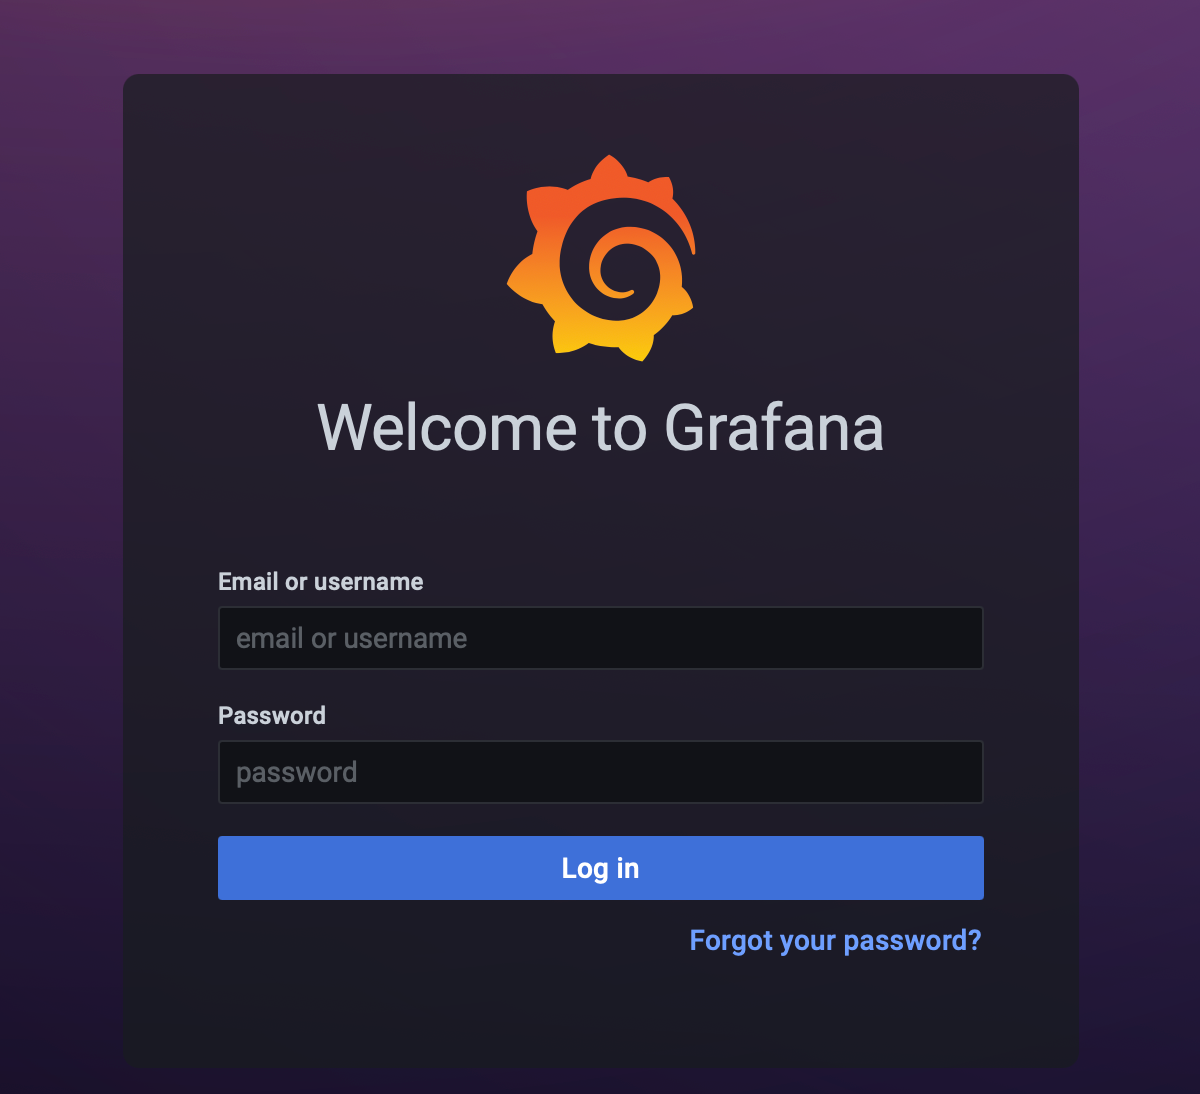
To log in for the first time, use the admin:admin username and password combination. Soon after that, you will have to change your password before you get into Grafana UI.
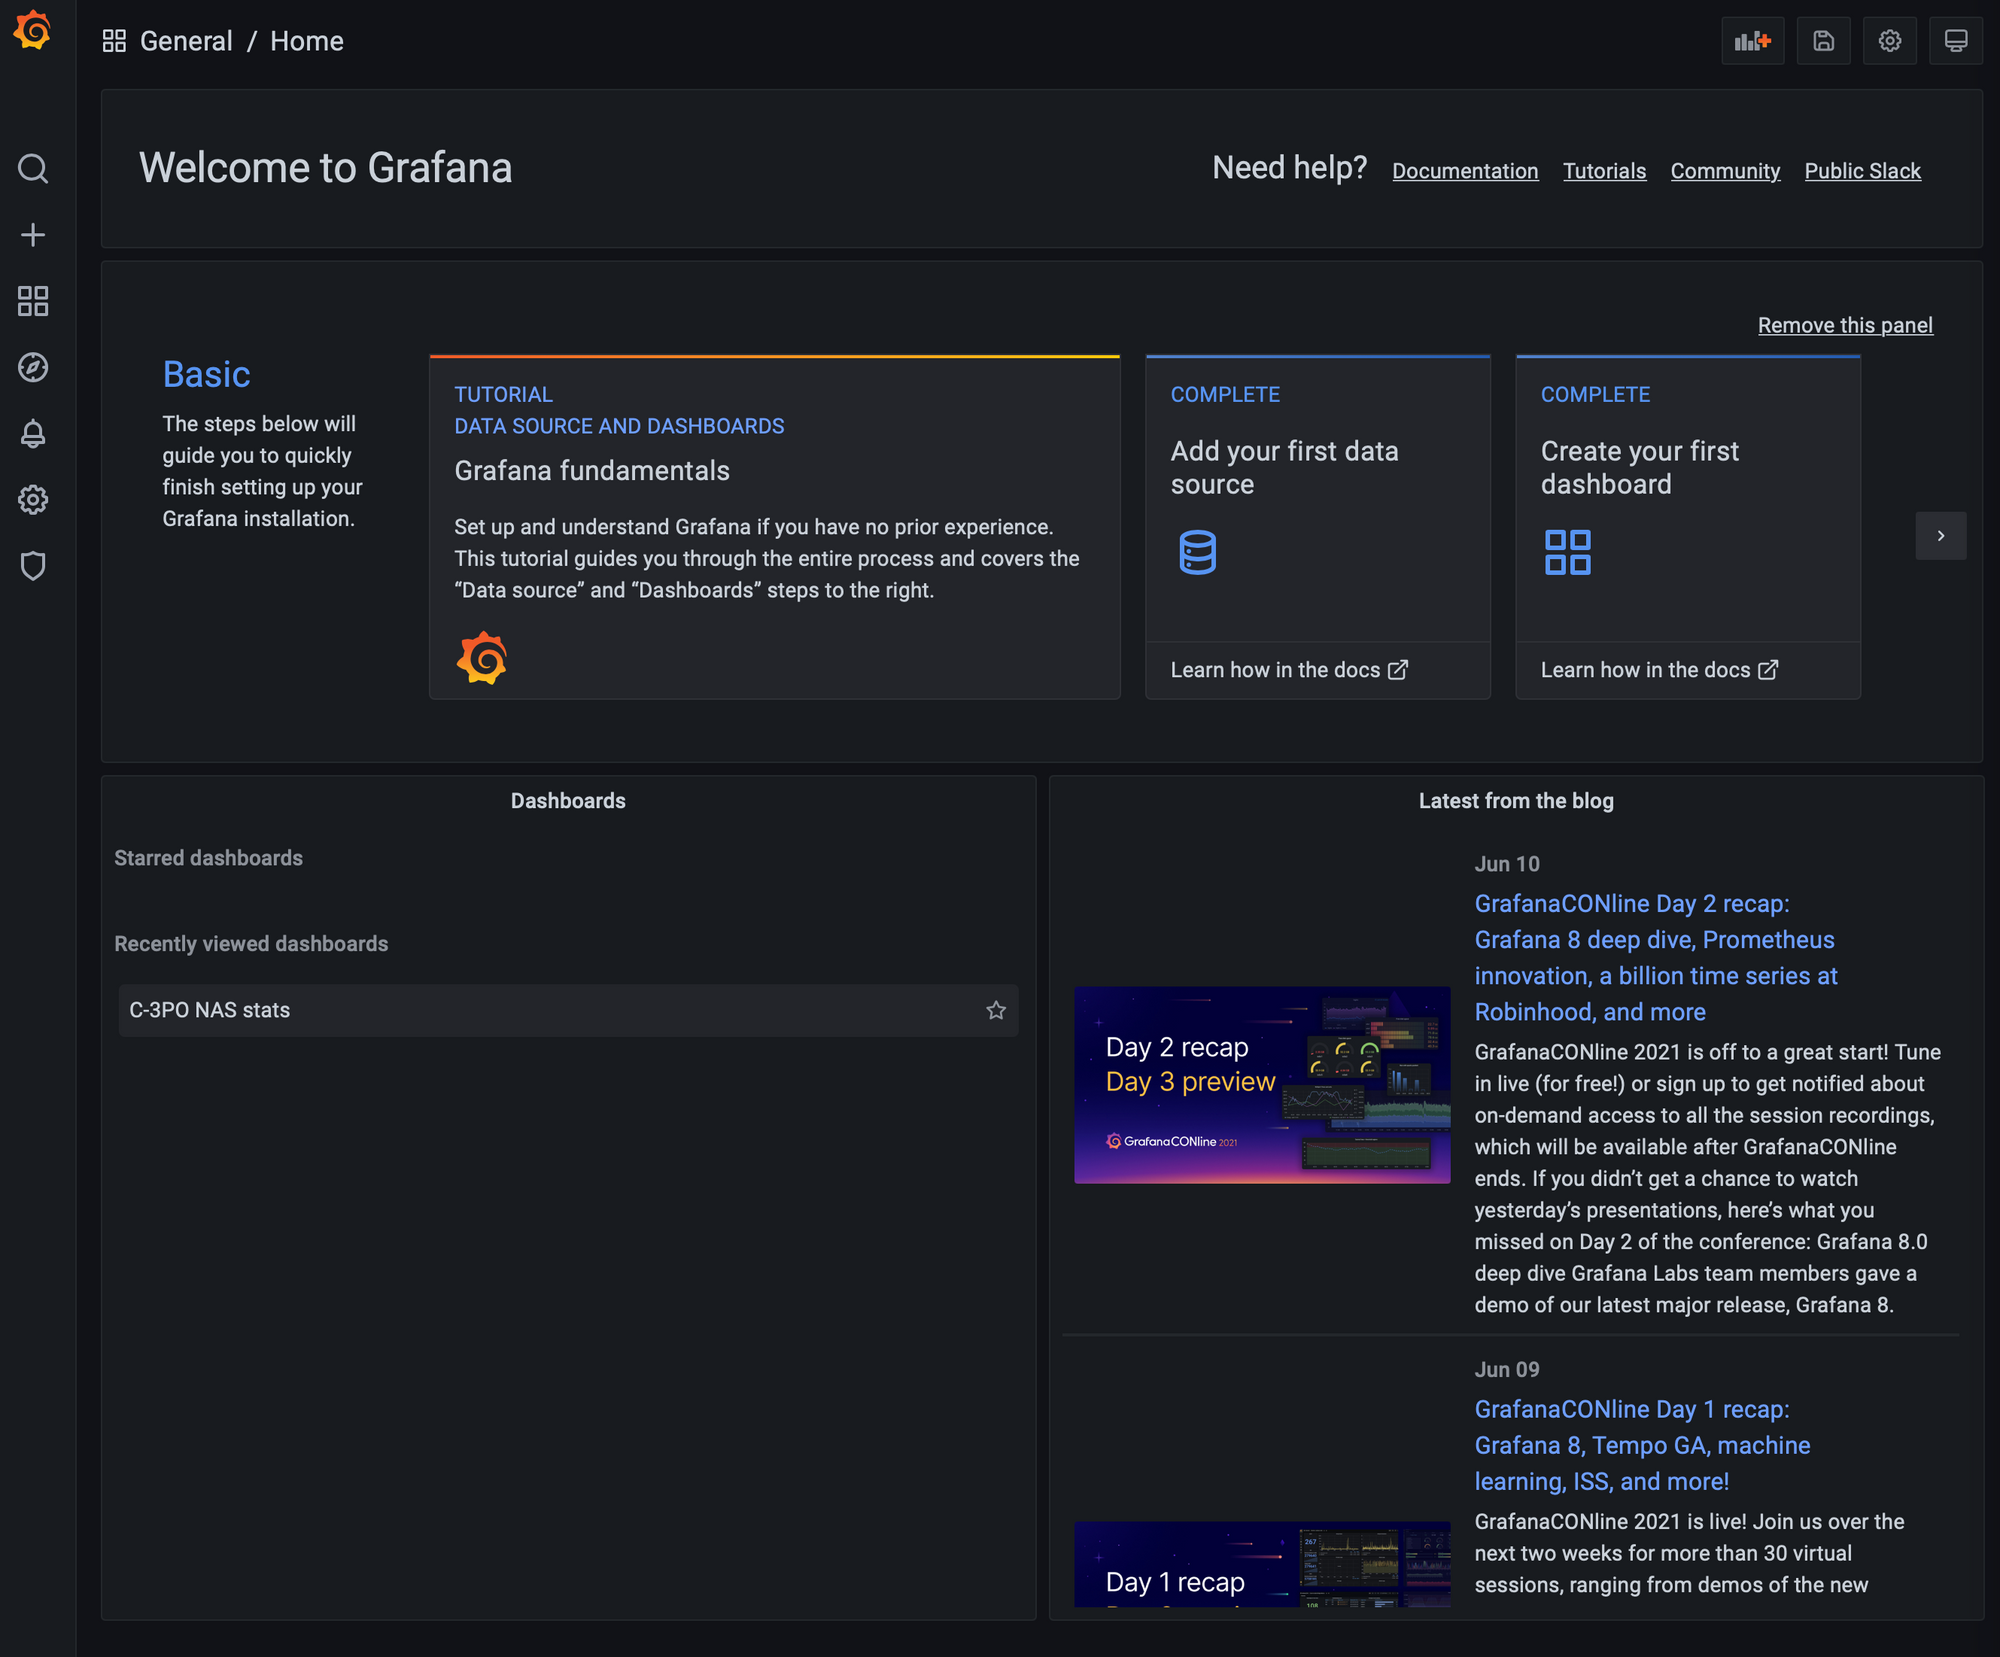
Now that we have all three containers up and running we can finally connect Grafana to your InfluxDB and start presenting the metrics.
Connecting Grafana to InfluxDB
Connect your Grafana with the new InfluxDB2 is the same as before with a small change that will ask you to use all the parameters that were configured in Influx docker-compose as well as the telegraf token value.
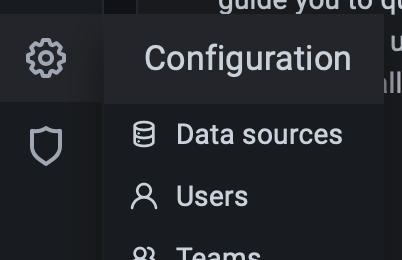
Go to Grafana main menu > Configuration > Data Sources.
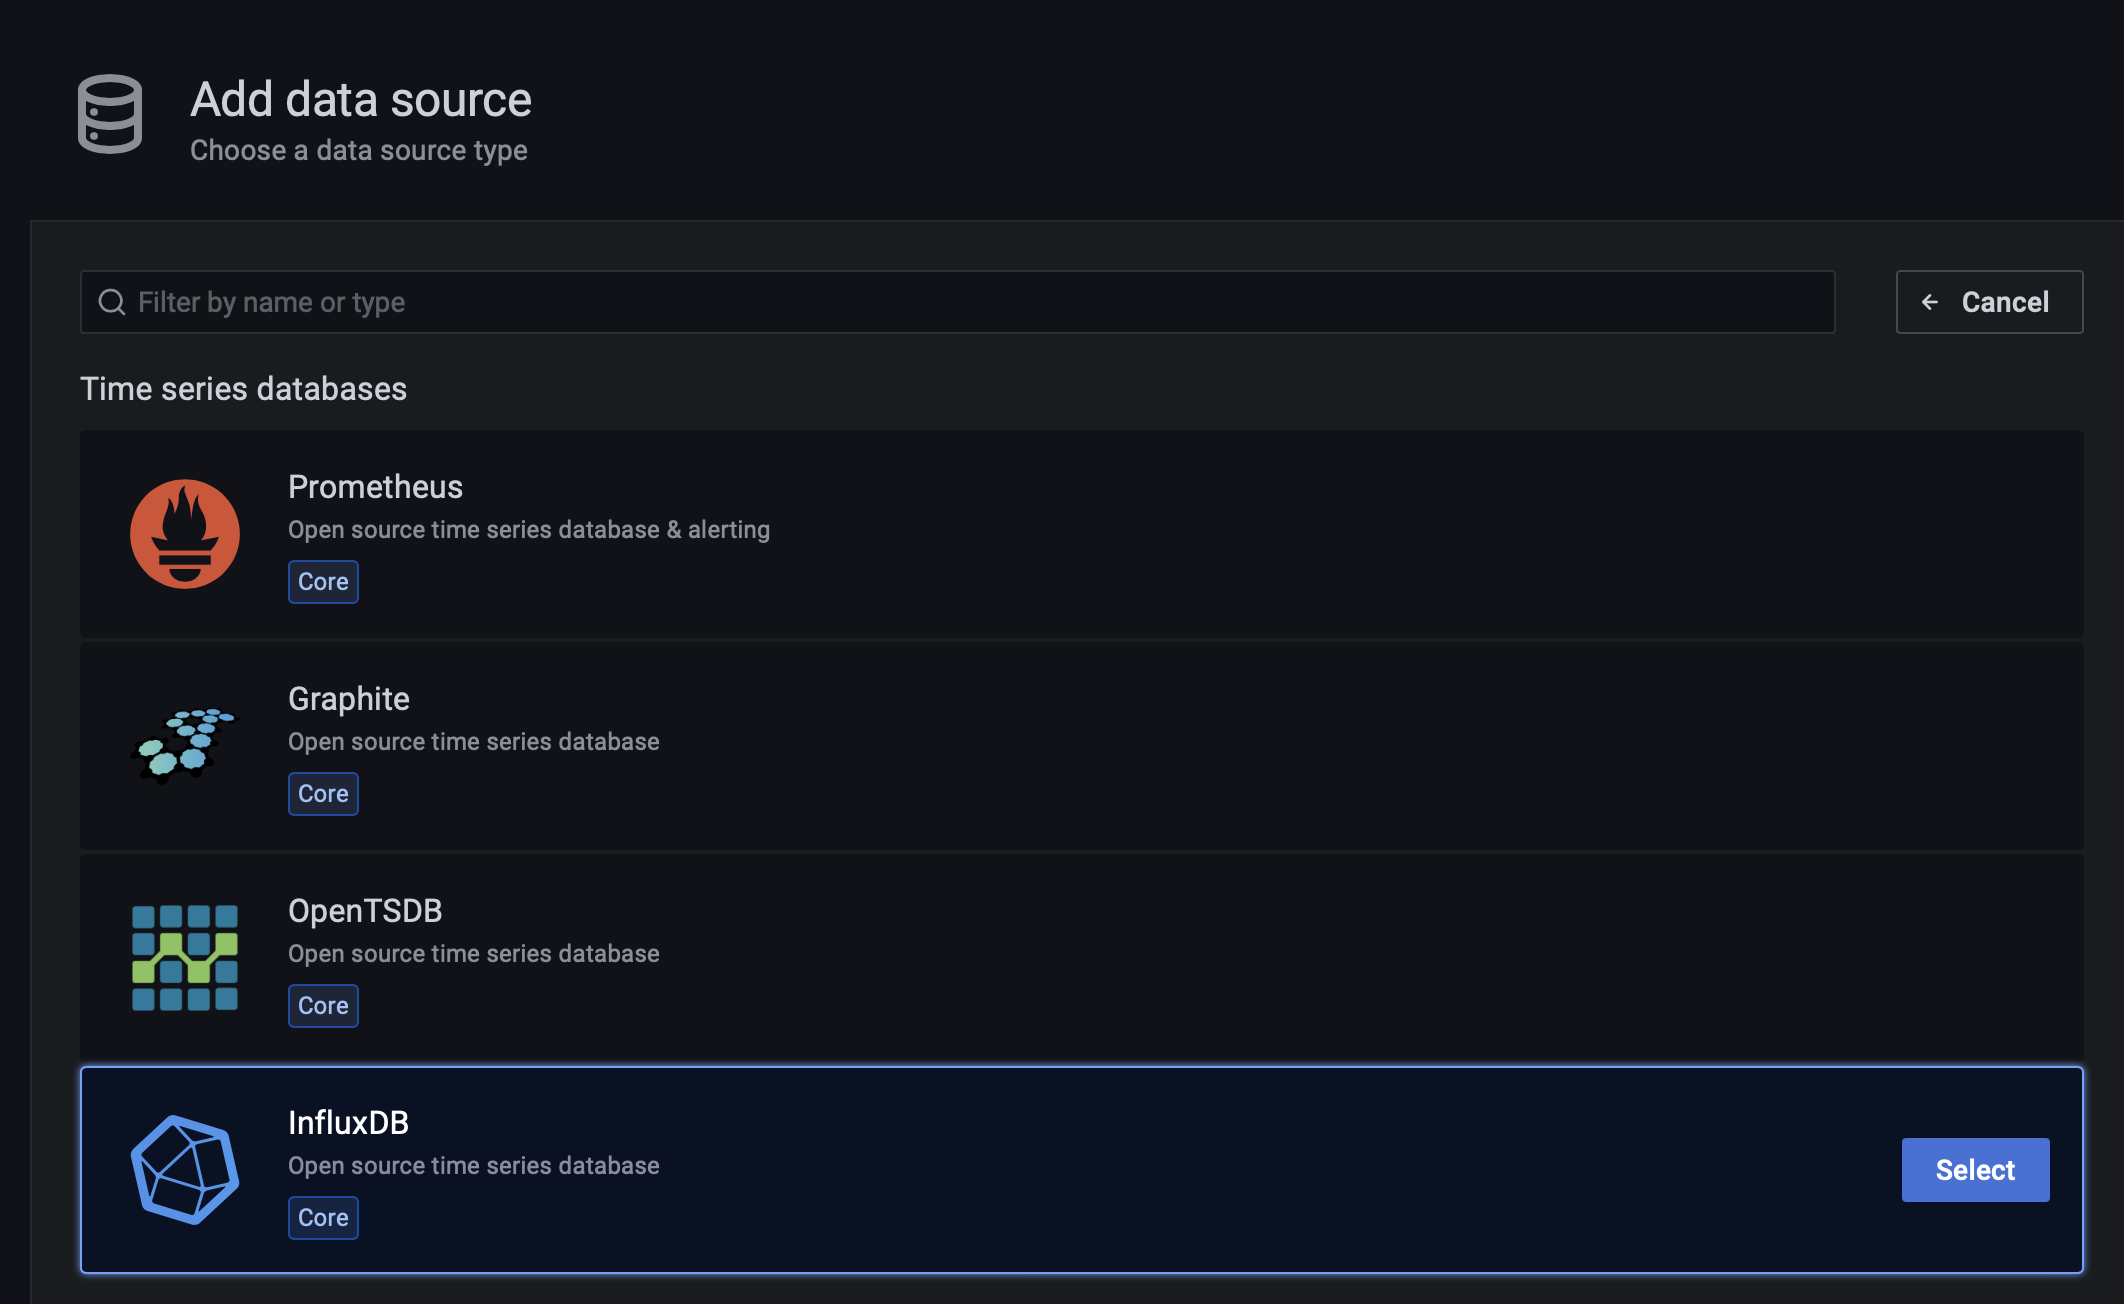
Select the InfluxDB database and click the select button.
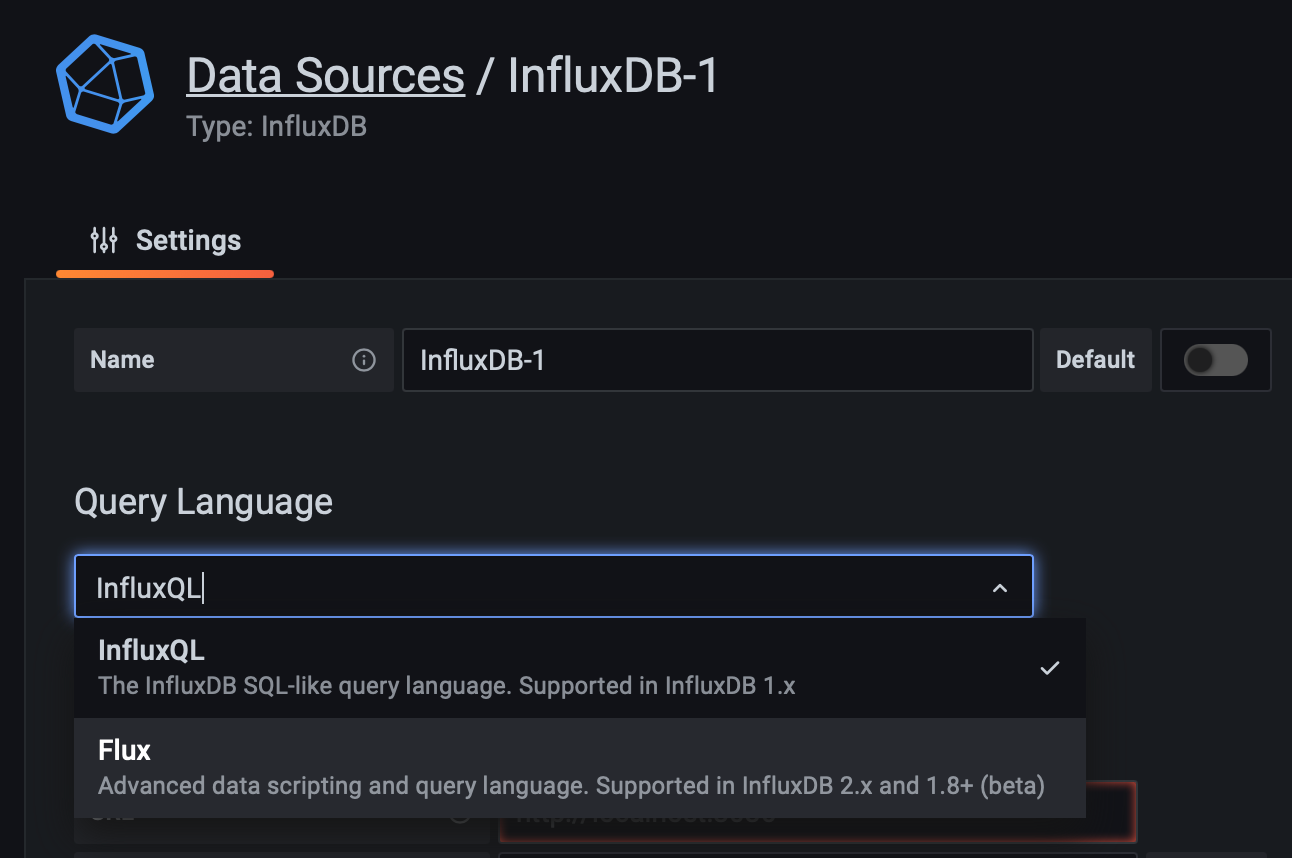
Give your connection a name and make sure to switch to Flux as the query language.
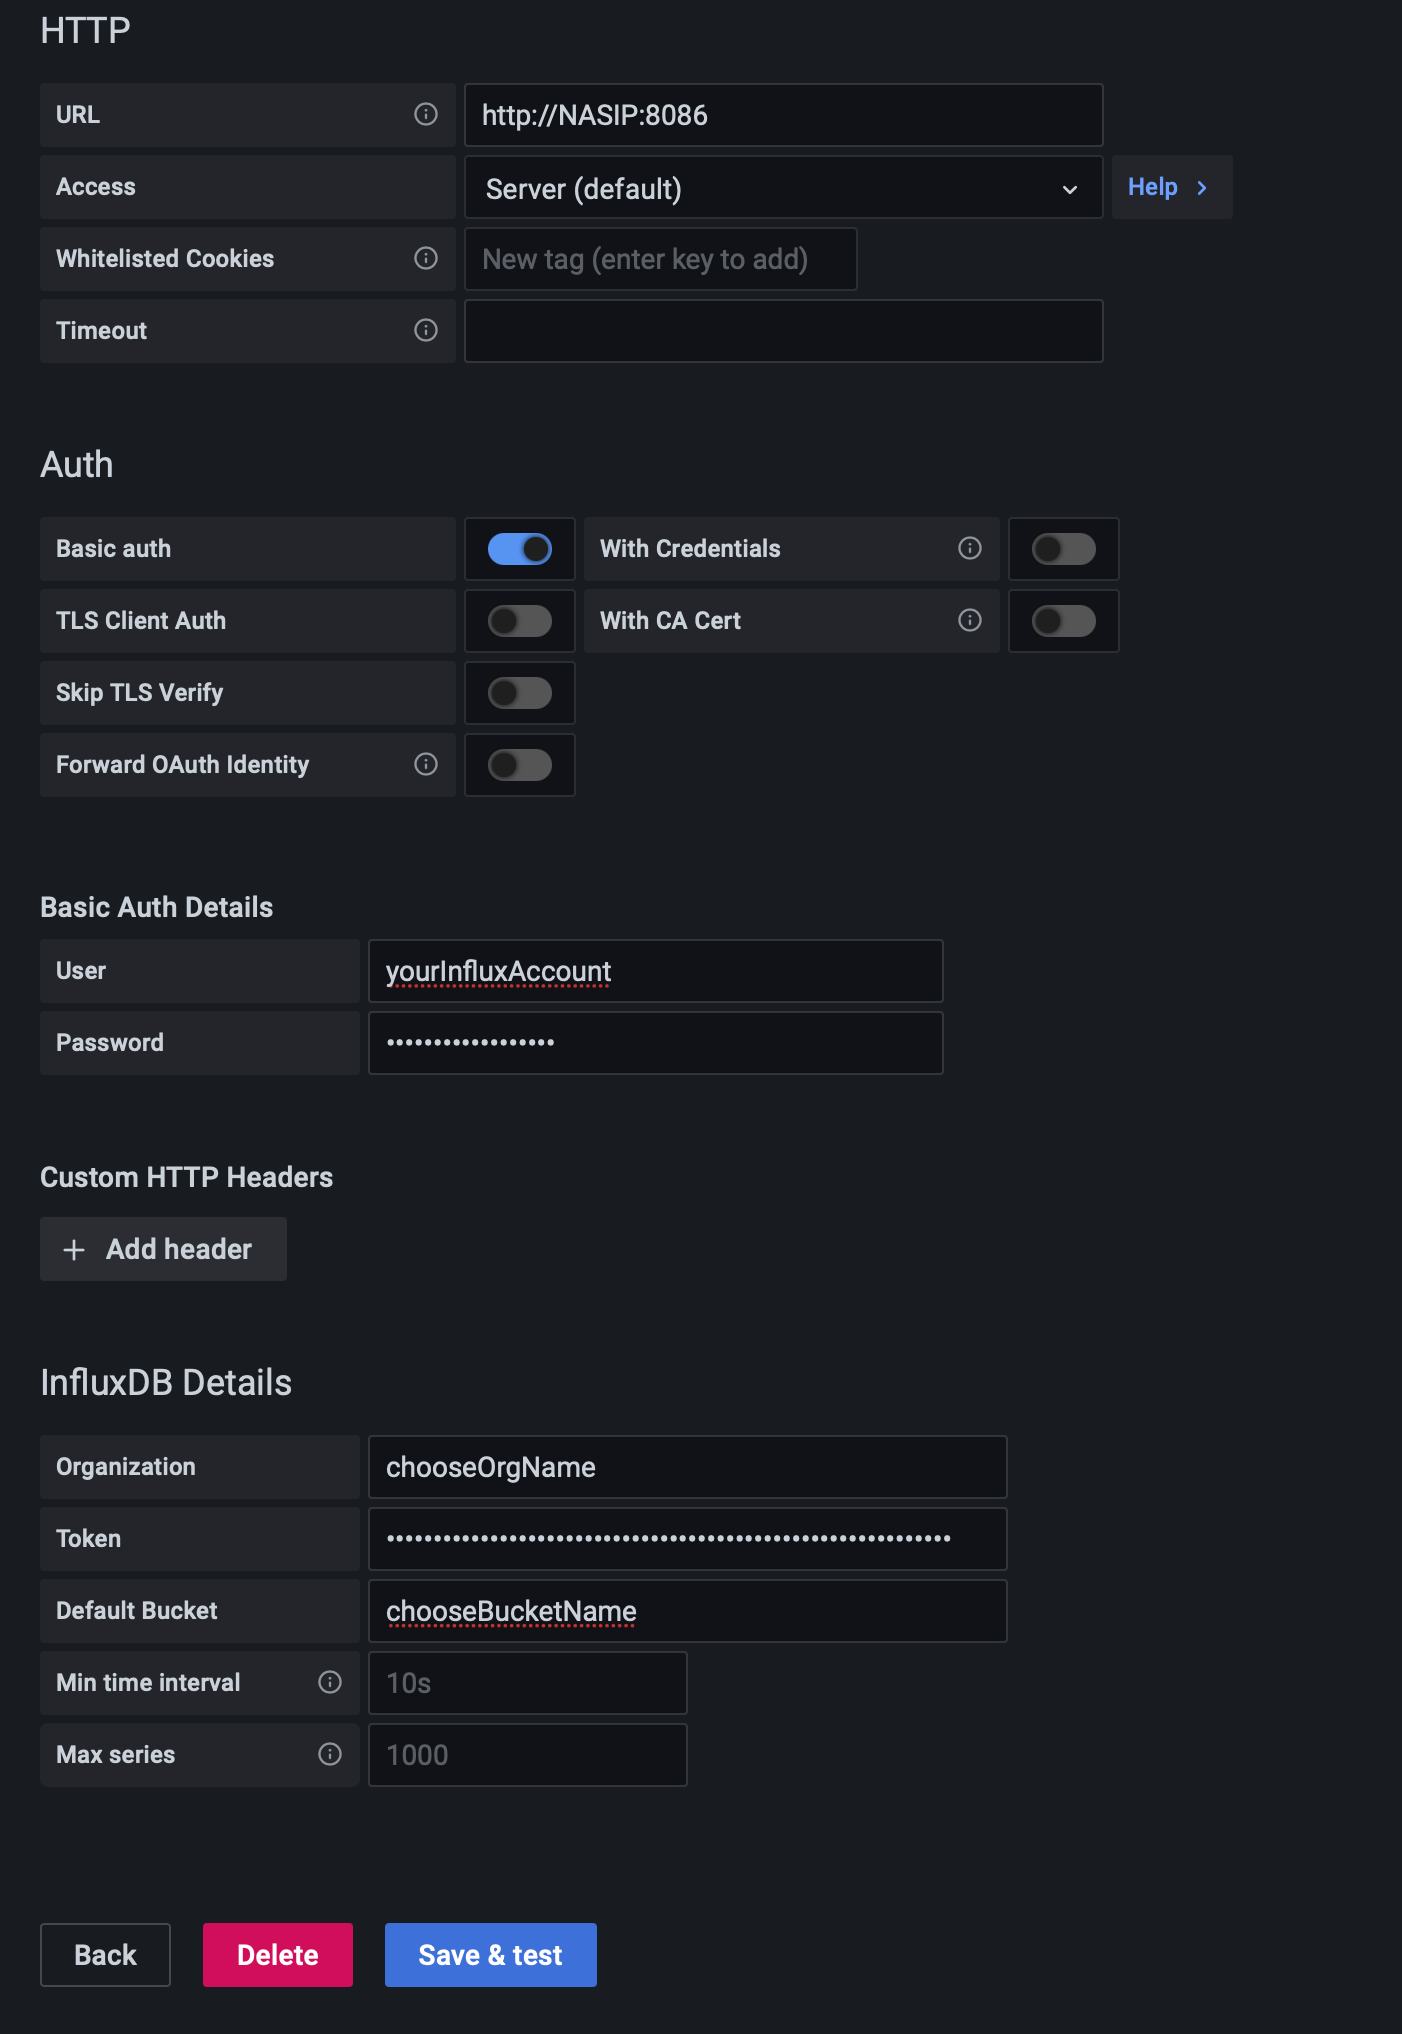
Use the parameters from the Influx docker-compose except for the token. The token value is the telegraf token value that you have configured using the InfluxDB web UI.
Finally, click the Save & test and you should get the green message for a successful connection.
Pulling in your metrics and presenting them with Flux
As in the initial article, I will not make this one about how to generate your own queries that will present your data, but as I said before, you can use the InfluxDB Explorer to generate your query and then paste it to your Grafana dedicated panels inside your dashboards.
Here are the examples of CPU %, RAM, and HDD % usage for your Synology box:
CPU % example
from(bucket: "NAMEOFYOUBUCKET")
  |> range(start: v.timeRangeStart, stop: v.timeRangeStop)
  |> filter(fn: (r) => r["_measurement"] == "cpu")
  |> filter(fn: (r) => r["_field"] == "usage_idle")
  |> filter(fn: (r) => r["cpu"] == "cpu-total")
  |> filter(fn: (r) => r["host"] == "NAMEOFYOURHOST")
  |> aggregateWindow(every: v.windowPeriod, fn: mean, createEmpty: false)
  |> map(fn: (r) => ({ r with _value: r._value * -1.0 + 100.0 }))
  |> toFloat()
  |> yield(name: "mean")
RAM % example
from(bucket: "NAMEOFYOUBUCKET")
  |> range(start: v.timeRangeStart, stop: v.timeRangeStop)
  |> filter(fn: (r) => r["_measurement"] == "mem")
  |> filter(fn: (r) => r["_field"] == "used_percent")
  |> filter(fn: (r) => r["host"] == "NAMEOFYOURHOST")
  |> aggregateWindow(every: v.windowPeriod, fn: mean, createEmpty: false)
  |> yield(name: "mean")
HDD % example
from(bucket: "NAMEOFYOURBUCKET")
  |> range(start: v.timeRangeStart, stop: v.timeRangeStop)
  |> filter(fn: (r) => r["_measurement"] == "disk")
  |> filter(fn: (r) => r["_field"] == "used")
  |> filter(fn: (r) => r["path"] == "/")
  |> filter(fn: (r) => r["host"] == "NAMEOFYOURHOST")
  |> aggregateWindow(every: v.windowPeriod, fn: mean, createEmpty: false)
  |> yield(name: "mean")
Conclusion
Nothing much has changed in comparison to the previous article, and the biggest change is the usage of Flux language. So make sure to have that in mind as moving your dashboards will require altering queries.
As always be sure to tell me about it in the comment section below.